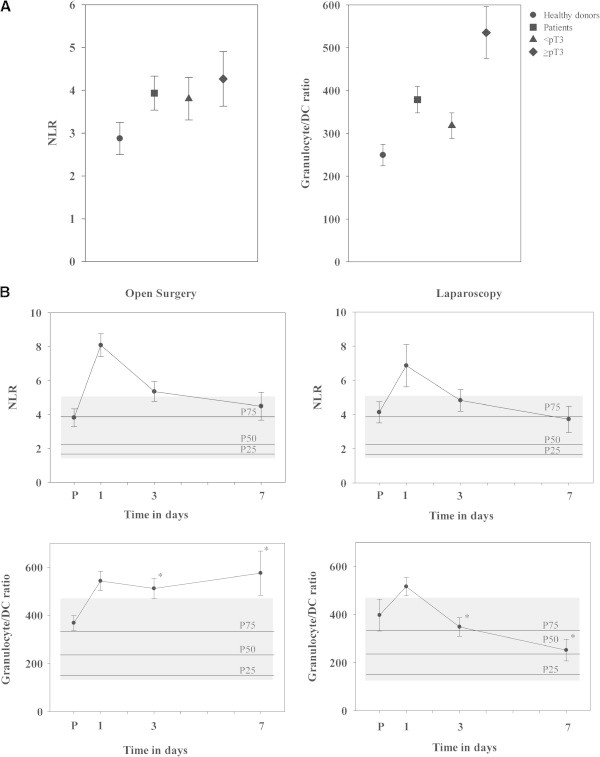
Figure 2.

Comparison of NLR and granulocyte/DC ratio. NLR and granulocyte/DC ratio were compared between the control group and RCC patients (all patients together, or with patients < pT3 and ≥ pT3), shown in (A). Comparison of both markers in RCC patients undergoing open surgery or laparoscopy (B). An one-week time course of NLR and granulocyte/DC ratio is shown. Values of control group are illustrated as hatched areas and as percentiles, with the 25th percentile (P25), P50 and P75. Significant differences between adjacent points are marked by an asterisk.
