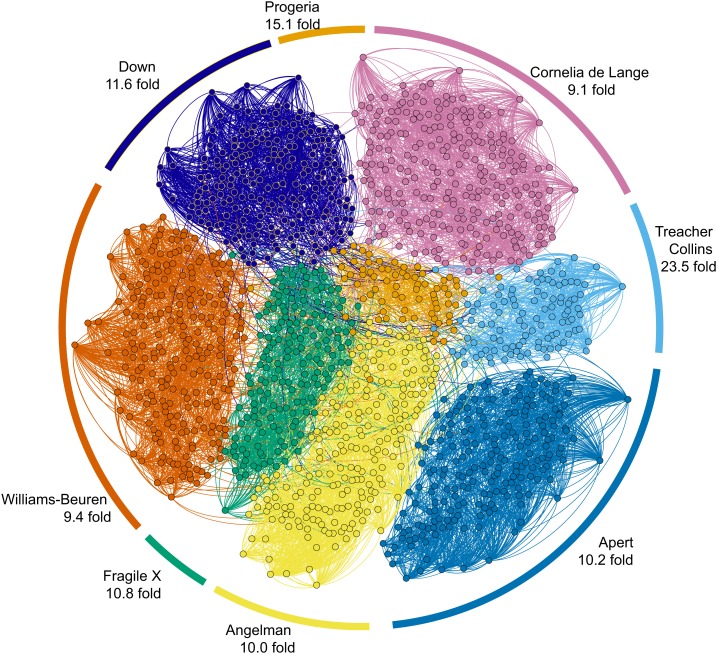
Figure 3. Clinical Face Phenotype Space enhances the separation of different dysmorphic syndromes.
The graph shows a two dimensional representation of the full Clinical Face Phenotype Space, with links to the 10 nearest neighbors of each photo (circle) and photos placed with force-directed graphing. The Clustering Improvement Factor (CIF, fold better clustering than random expectation) estimate for each of the syndromes is shown along the periphery.

