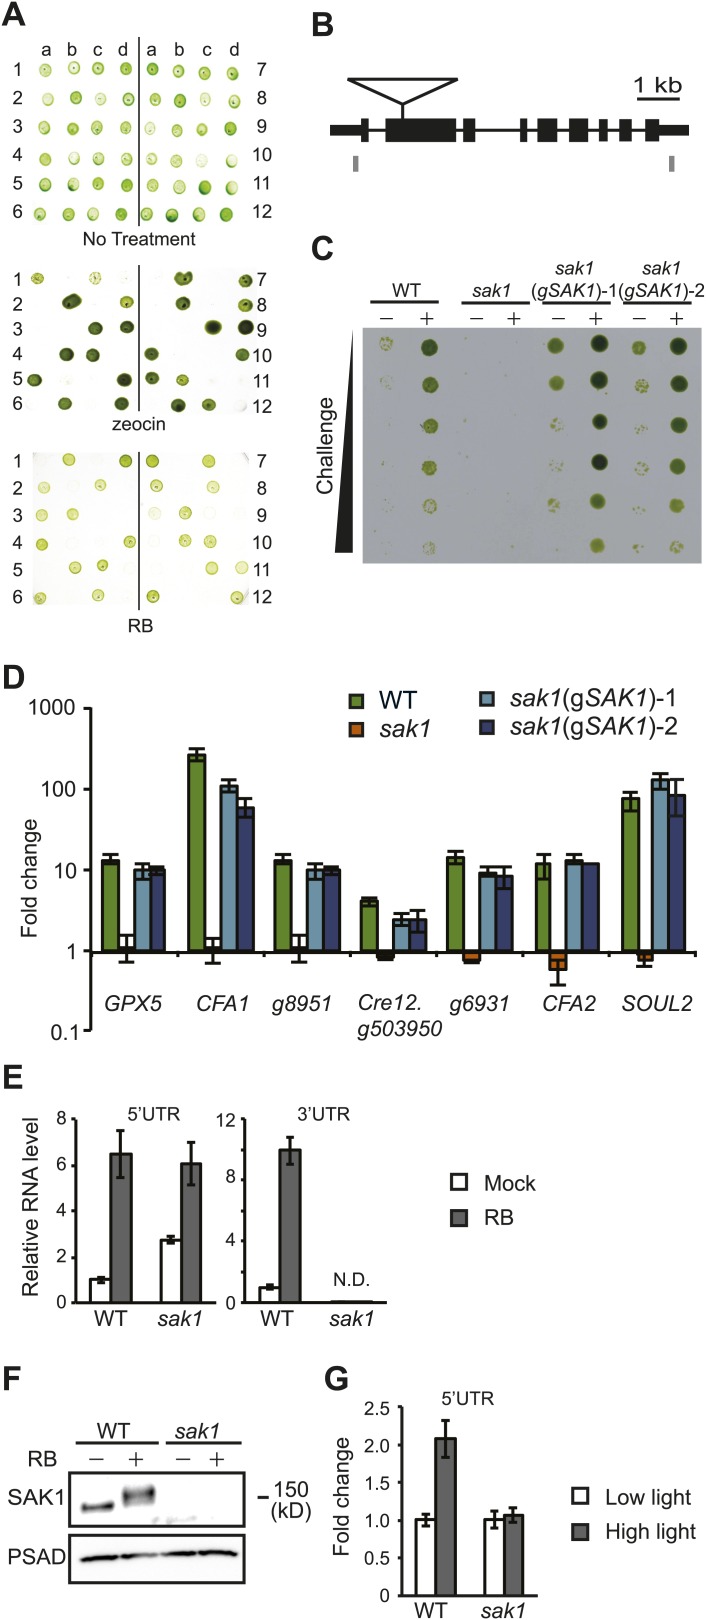
Figure 4. Genetic and molecular analysis of sak1.
(A) The insertion of a zeocin resistance gene and the RB sensitivity phenotype are linked. Twelve complete tetrads from a backcross of sak1 to wild type are shown. Numbers indicate independent tetrads, and letters (a-d) indicate the individual progeny from tetrads. (B) Gene structure of SAK1 and the insertion site. Gray boxes indicate positions of primers used for qPCR. (C) Transformation of sak1 with a genomic fragment containing SAK1 rescues the acclimation phenotype. sak1(gSAK1)-1 and sak1(gSAK1)-2 are two independent transformants. (D) sak1(gSAK1)-1 and sak1(gSAK1)-2 show recovery of 1O2 target gene expression. Y-axis indicates fold change during acclimation to 1O2. (E) qRT-PCR of SAK1 in WT and sak1 mutant using primers for 5′- and 3′-UTR shown in panel B. (F) SAK1 protein is induced in WT and detected as higher molecular weight bands during acclimation to 1O2 generated by RB. (G) SAK1 transcript probed for 5′-UTR in cells transferred from low light to high light for 1 hr. Error bars indicate standard deviation of biological triplicates.

