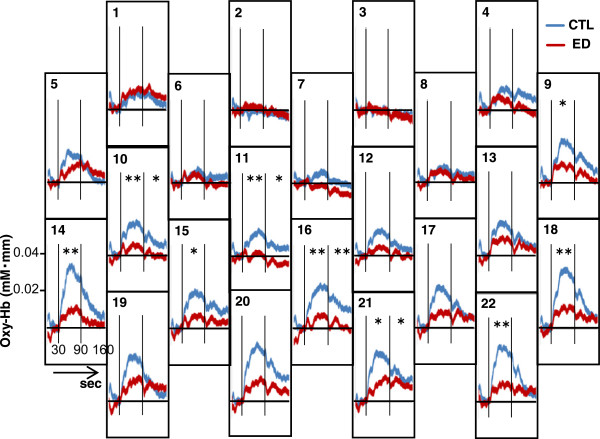
Figure 2.

Grand averaged waveforms of oxygenated hemoglobin concentration (Oxy-Hb) during the 60-s letter fluency task. Blue lines represent the control group (CTL) and red lines represent patients with eating disorders (ED). Vertical lines indicate the beginning and end of the letter fluency task. *p < 0.05 and **p < 0.01 between Oxy-Hb in the ED group and Oxy-Hb in the CTL group in the task period or the post-task period, as assessed by independent t-test and before correction by the false discovery rate method.
