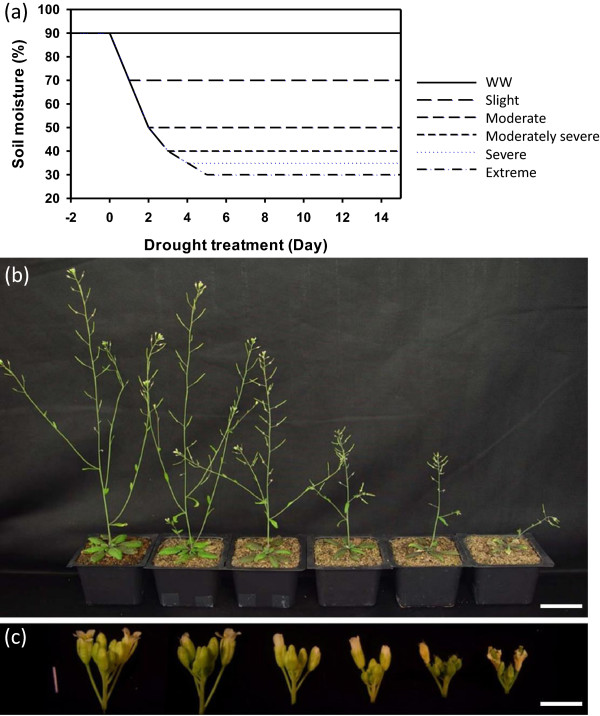
Figure 1.

Experimental design of different drought severities and overview of phenotypical changes of plant under drought. (a) Time course of soil moisture measurement during the drought treatment, the x-axis indicates the start and the duration of drought. (b) Whole plants were photographed after ten days of treatment under six conditions (from left to right: Well-watered, Slight drought, Moderate drought, Moderately severe drought, Severe drought, Extreme drought). (c) Inflorescences dissected from the plants in panel b were photographed. Bars represent 5 cm in (b) and 3 mm in (c).
