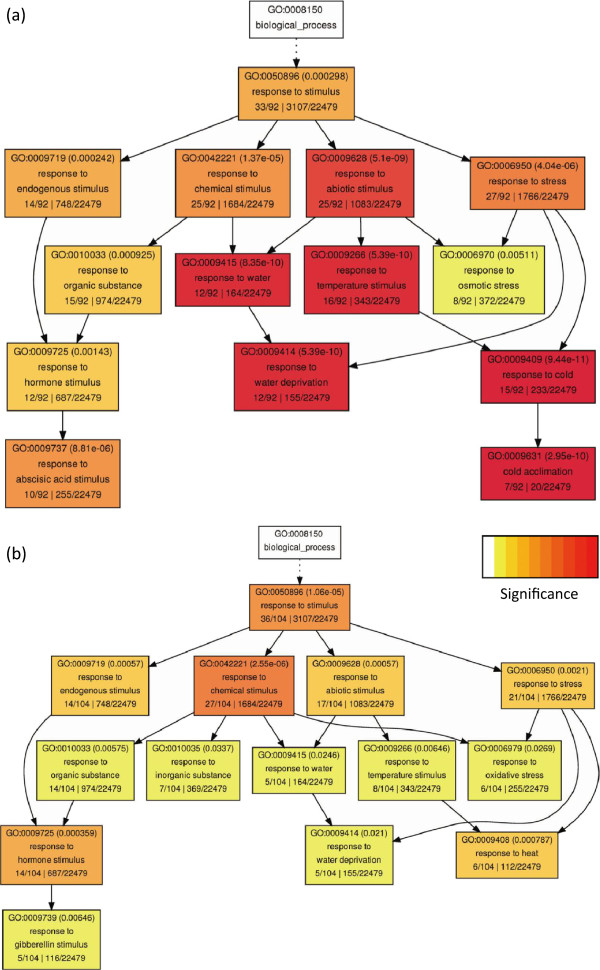
Figure 4.

GO enrichment analysis of the gene group that differentially expressed in both severe and moderate drought condition. (a) The list of genes obtained from the overlapping gene group in both M3/C0 and M3/C3 in Figure 3b. (b) The list of genes from the overlapping gene group in both M3/C0 and M3/C3 in Figure 3c. Significance bar represents p-value from 1 × 10⁻¹ to 1 × 10⁻¹⁰. P-values are shown in bracket of each box and gene count of each group is also included in the bottom line of the same box.
