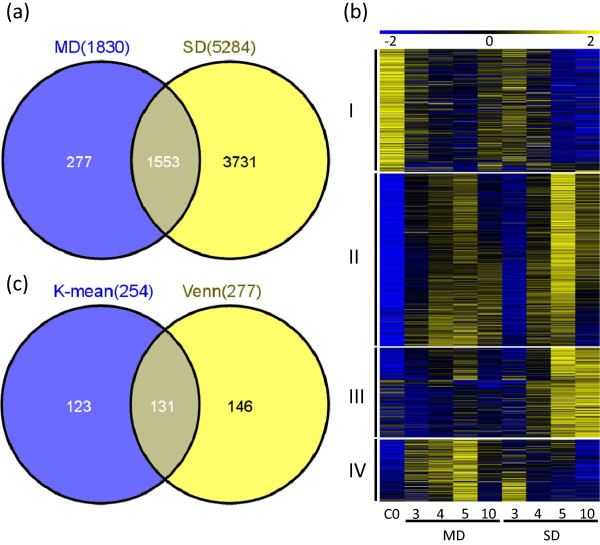
Figure 5.

Comparison of transcriptomes of inflorescence under moderate drought and severe drought. (a) Venn diagram analysis showed the comparison on the differential expressed genes from moderate and severe drought treated plants. (b) K-means clustering of differentially expressed genes (1830) of moderate drought condition. The number indicates the fold change based on the normalized values of the hybridization signals in log2 format between one of the drought-treated groups and the control group (C0). (c) Comparison of the genes in the cluster IV of panel b (254 genes) with the genes specifically differentially expressed in moderate drought (277 genes in panel a).
