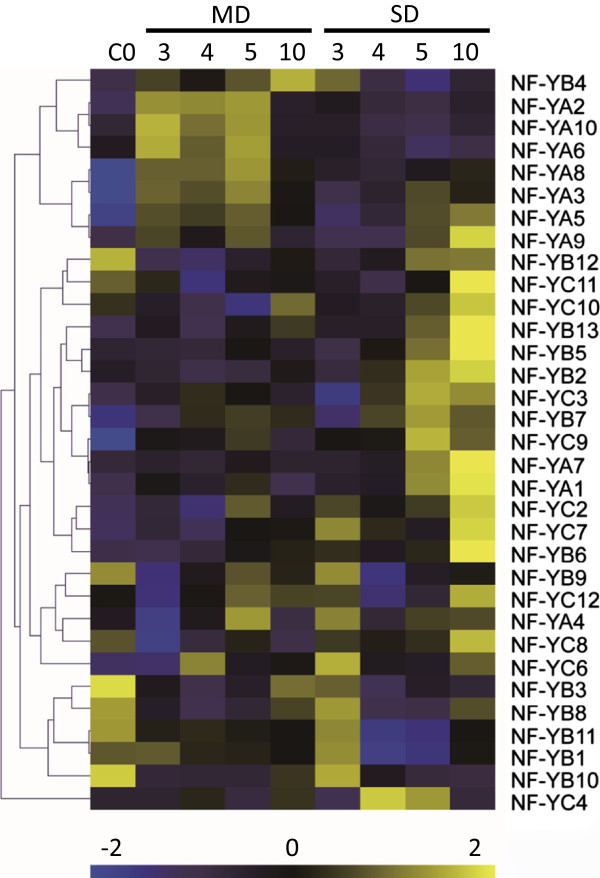
Figure 6.

Hierarchical clustering of NF-Y gene family under drought condition. Yellow color represents high expression while blue color represents low expression. Hierarchical clustering was performed on transcripts ratios of all conditions. C represents control: well-watered group; MD represents moderate drought; SD represents severe drought.
