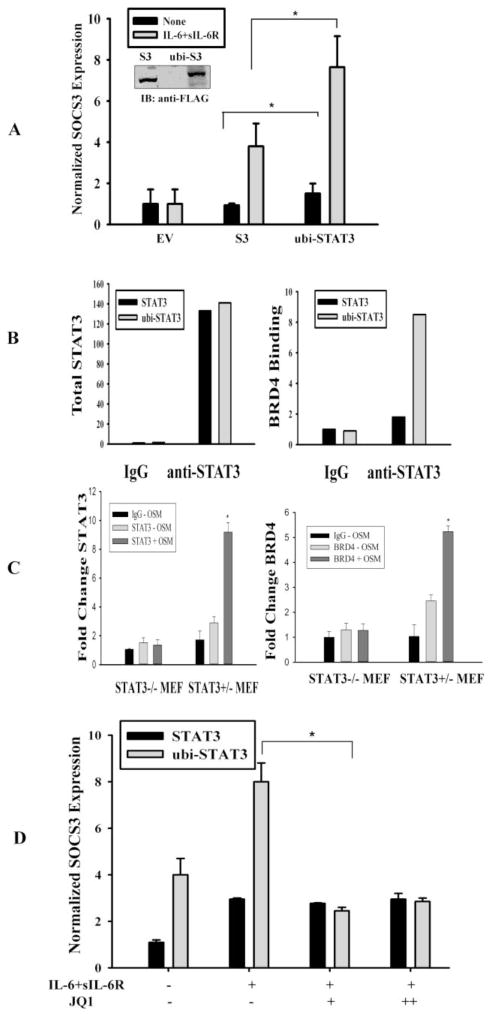
Fig. 4.
ono-ubiquitinated STAT3 has increased transcriptional activity and is BRD4-dependent. (A) HEK 293 cells were transfected either with empty vector (EV) or with Flag-mcherry-STAT3 expression vector (S3) or with Flag-mcherry-ubiquitin-STAT3 fusion protein (ubi-STAT3). 40 h after transfection cells were either treated with IL-6 and sIL-6R for 20 mins or left untreated and total RNA was subjected to Q-RT-PCR for human SOCS3 expression. Data are expressed as mean±SD, * indicates P< 0.05. The inset figure shows expression of Flag tagged STAT3 and ubi-STAT3 FP. (B) HEK 293 cells were transfected with Flag-tagged STAT3 or Flag- tagged ubi-STAT3 FP and WCL were IP’ed either with IgG or anti-STAT3 Ab and subjected to SID-SRM analysis (described experimental procedures) for STAT3 and BRD4 abundance. The results of SID-SRM assay were normalized with total input concentrations of the WCL. The left panel figure shows the total STAT3 detected in each sample and right panel shows relative ratio of BRD4 associated with STAT3 in each samples. (C) STAT3 and BRD4 binding to SOCS3 promoter by XChIP assay. STAT3−/− and STAT3+/− MEF cells were treated with or without the STAT3 agonist, OSM (20 ng/ml) for 30 min. Double cross-linked chromatin was IPed with either IgG, anti-STAT3 (STAT3) or anti-BRD4 antibody (BRD4) and bound chromatin was amplified by Q-gPCR using a mSOCS3 promoter-specific primer pair. Fold change is expressed relative to IgG. *p< 0.01. (D) HEK 293 cells were transfected with either STAT3 or ubi-STAT3 FP. 24 h after transfection cells were treated with JQ1 at a concentration of 10 μM and 50 μM for overnight and total RNA was isolated prior to IL-6 and sIL-6R treatment. Human SOCS3 mRNA expression was measured by Q-RT-PCR. Data are expressed as mean ±SD, * indicates p< 0.05.

