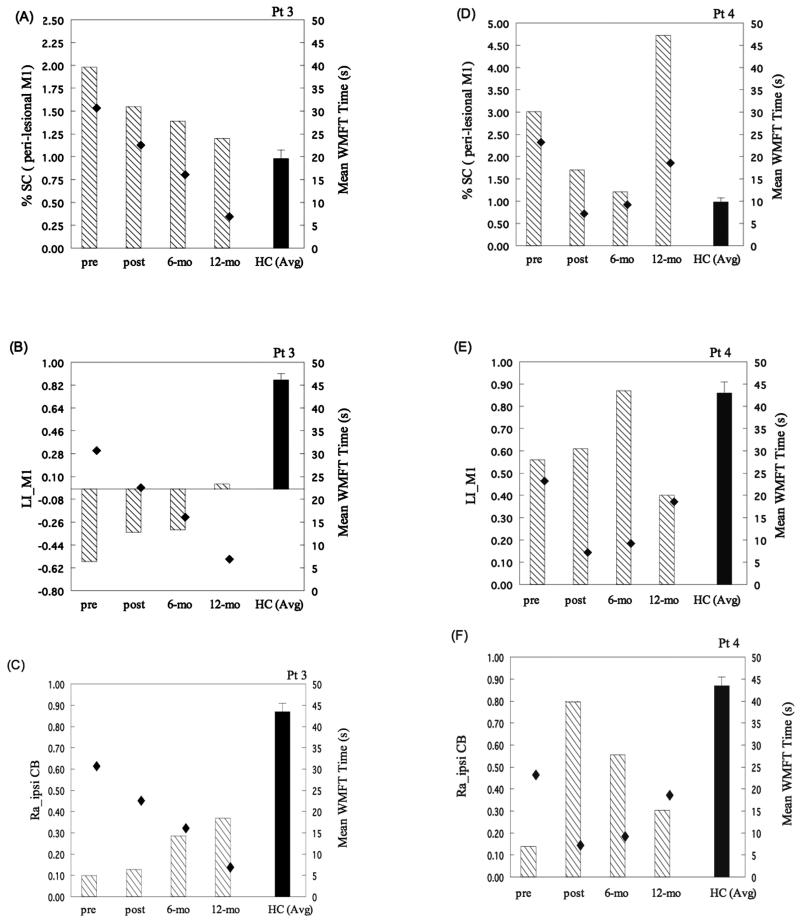
Figure 5.
Relationships between functional magnetic resonance imaging (fMRI) activation (%SC, LI_M1, and Ra_ipsiCB; left y-axis) and motor performance (mean WMFT time; right y-axis) across time in patients 3 and 4. Functional MRI activation patterns, including (A, D) %SC of perilesional M1 activation, (B, E) LI_M1, and (C, F) Ra_ipsiCB plotted versus mean WMFT time across time. For patient 3, across the 4 time points, a close relationship between fMRI activation and motor performance was observed—namely, a lower %SC in perilesional M1, a higher LI_M1, and a greater Ra_ipsiCB corresponded to a better motor performance, as indexed by shorter WMFT time. For patient 4, across the 4 time points, only Ra_ipsiCB paralleled the degree of motor improvement (ie, a greater Ra_ipsiCB corresponded to a better motor performance). Dashed bar, fMRI activation in perilesional M1 and cerebellum in patients. Solid bar = fMRI activation in perilesional M1 and cerebellum in healthy controls. Diamond symbol = mean WMFT time. Pre = before therapy; post = immediately after therapy; 6-mo = 6 months after therapy; 12-mo = 12 months after therapy; %SC = percent signal change; Ra_ipsiCB = ratio of the ipsilateral cerebellar activation; CB = cerebellum; WMFT = Wolf Motor Function Test.

