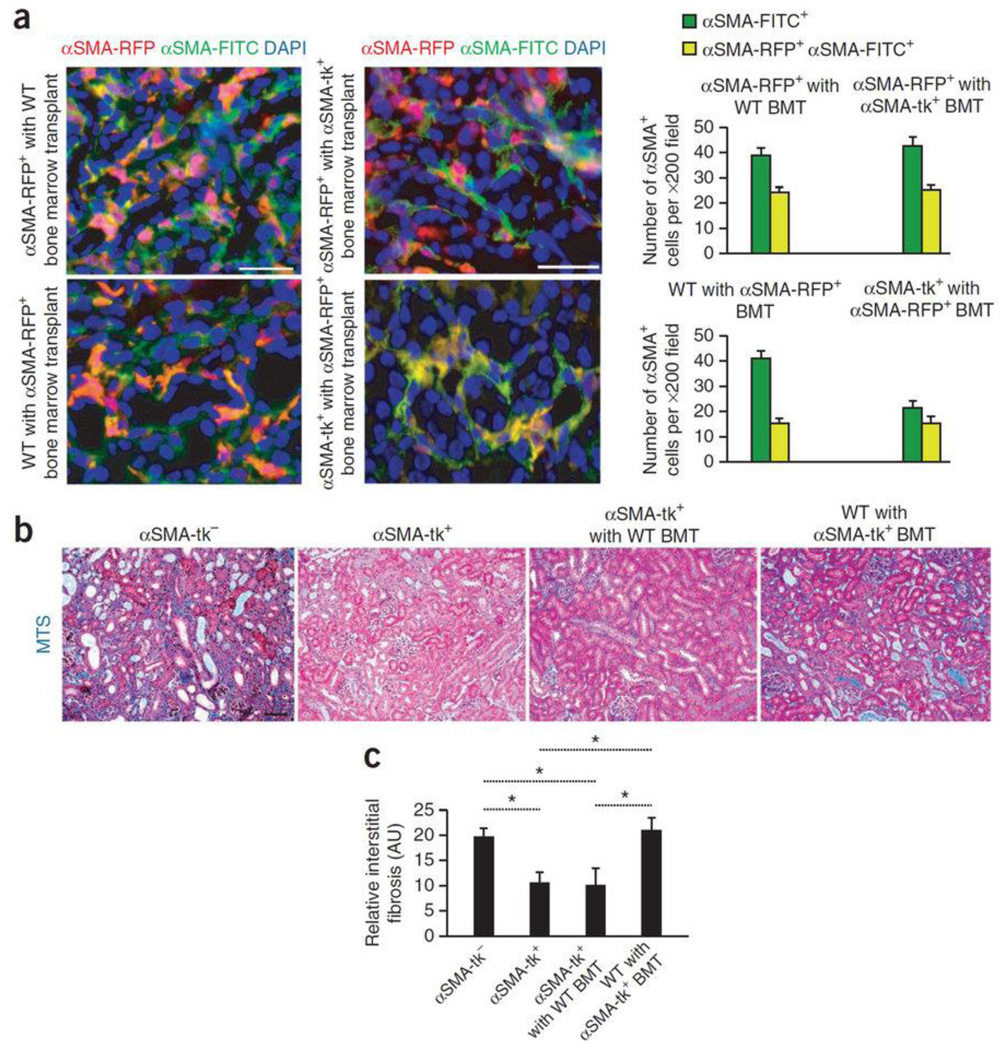
Fig. 2. Bone marrow derived myofibroblasts contribute to fibrosis and emerge independently from proliferation.
(a) Immunolabeling for all αSMA+ cells (αSMA-FITC+) of fibrotic kidney of indicated experimental groups. Graph depicts the number of all αSMA+ cells (αSMA-FITC+) and αSMA-RFP+/αSMA-FITC+ cells from either bone marrow or resident, depending on host/donor transplantation group (in each group n = 5). Left panels are insets from Fig. 1a–b. (b) Representative Masson Trichrome staining (MTS) of littermate wild type (WT) control (αSMA-tk−, n = 5), αSMA-tk+ (n = 5), αSMA-tk+ with WT bone marrow transplant (BMT) (n = 5), and WT with αSMA-tk+ BMT fibrotic kidneys treated with GCV (n = 5). (c) Morphometric analysis for relative interstitial fibrosis in indicated experimental groups. AU: Arbitrary Units. DAPI (blue): nuclei. Scale bar: 50 µm. Data is presented as mean ± s.e.m. t-test, *P < 0.05.

