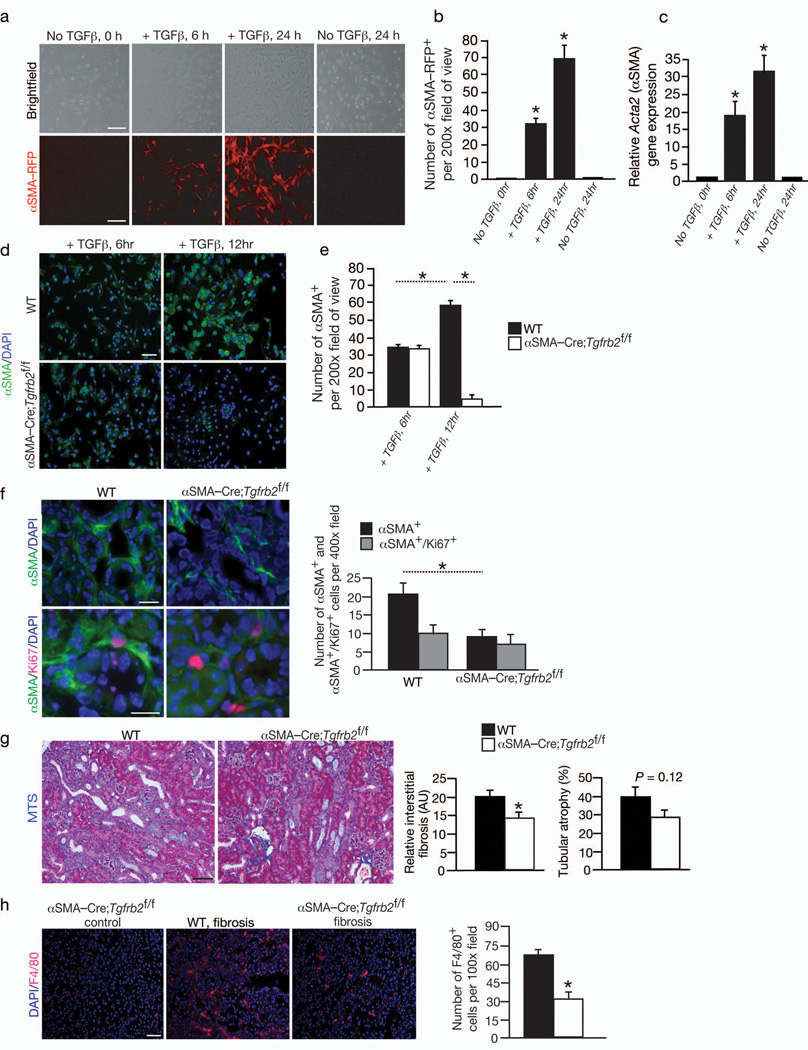
Fig. 3. Bone marrow derived cells differentiate into αSMA+ myofibroblasts in fibrosis via Tgfbr2 signaling pathway.
(a). Brightfield and RFP imaging of MSCs from αSMA-RFP mice (n = 3) treated with TGFβ1 and (b) quantitation of the number of αSMA-RFP+ cells per visual fields. (c) Relative Acta2 (αSMA) expression by Q-PCR analysis in bone marrow derived mesenchymal stem cells (MSCs) cultured with and without TGFβ1 stimulation. (d) αSMA-FITC labeling of MSCs from littermate control WT (n = 3) and αSMA-Cre;Tgfbr2f/f mice (n = 3) treated with TGFβ1 at the indicated time and (e) quantitation of the number of αSMA+ cells per visual fields. (f) Immunolabeling for αSMA and Ki67 in fibrotic kidney of WT (n = 5) and αSMACre; Tgfbr2f/f mice (n = 4) and quantitation of αSMA+ and αSMA+/Ki67+ myofibroblasts. (g) Representative Masson Trichrome staining (MTS) of WT and αSMA-Cre;Tgfbr2f/f fibrotic kidneys, and morphometric analysis for relative interstitial fibrosis and tubular atrophy. (h) Immunolabeling and quantitative analysis for F4/80+ macrophages in αSMA-Cre;Tgfbr2f/f non-fibrotic (control) and WT and αSMA-Cre;Tgfbr2f/f fibrotic kidneys. AU: Arbitrary Units. DAPI(blue): nuclei. Scale bar: 50 µm. Data is presented as mean ± s.e.m. t-test, *P < 0.05.

