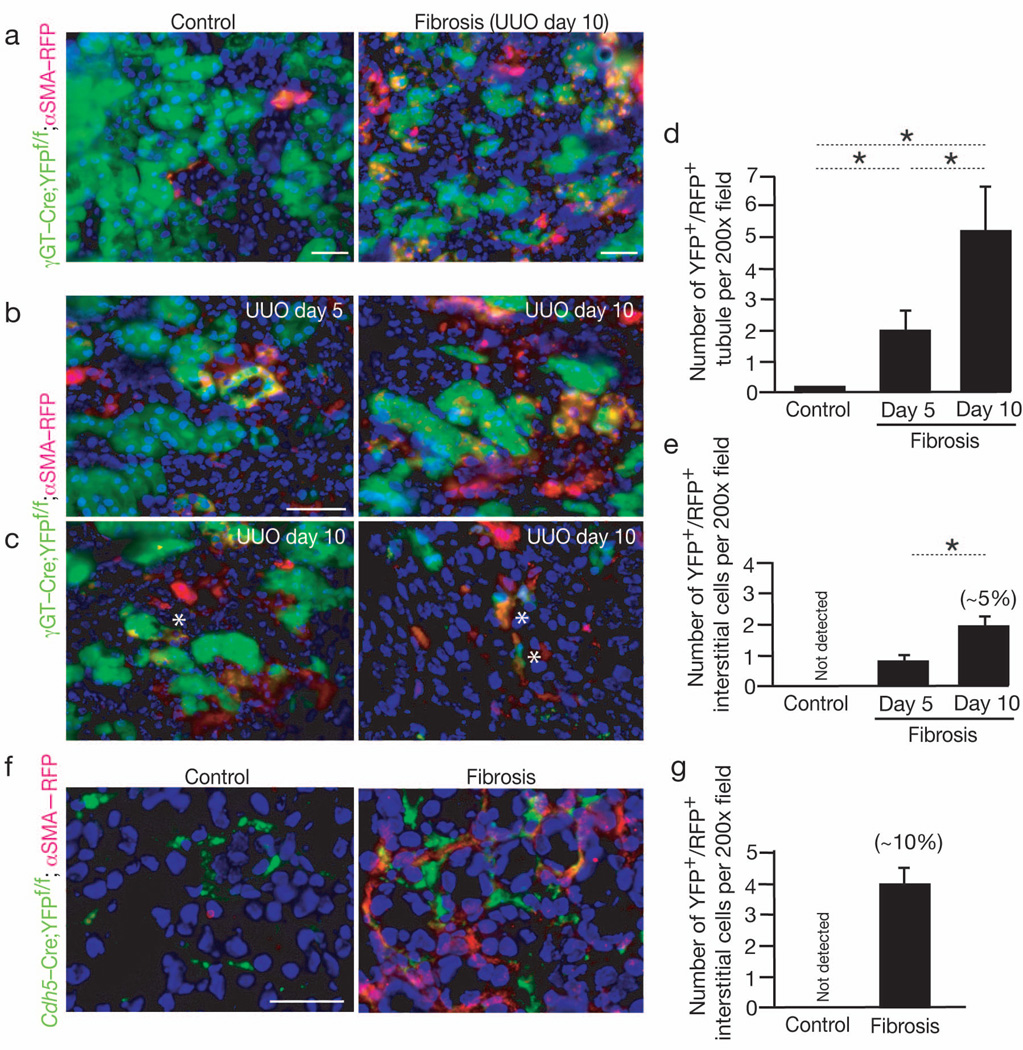
Fig. 5. Endothelial to Mesenchymal Transition contributes to myofibroblasts in fibrosis.
(a) Representative imaging of healthy and fibrotic kidney (Day 10 post UUO) from γGT-Cre;YFPf/f;αSMA-RFP mice: proximal tubules are green (YFP), interstitial myofibroblasts are red (RFP). (b–c) Higher magnification images of fibrotic kidney from γGT-Cre;YFPf/f;αSMA-RFP mice at day 5 post UUO (n = 3), and at day 10 post UUO (n = 5). A star (*) indicates (c, left panel) a double positive (YFP+/RFP+) epithelial cells departing from the tubular basement membrane, and (c, right panel) interstitial double positive (YFP+/RFP+) myofibroblasts. (d–e) Quantitation of double positive tubules (d) and interstitial myofibroblasts (e) in γGT-Cre;YFPf/f;αSMA-RFP mice: non-fibrotic (Control) kidneys and fibrotic kidneys at day 5 and day 10 post UUO. The percentage listed is based on the observed total number of αSMA+ interstitial cells on day 10 post UUO. (f) Representative imaging of healthy contralateral kidney (Control, n = 5) and fibrotic (Day 10 post UUO, n = 5) from Cdh5-Cre;YFPf/f;αSMA-RFP mice and (g) quantitation of double positive interstitial myofibroblasts. The percentage listed is based on the observed total number of αSMA+ interstitial cells on day 10 post UUO. DAPI(blue): nuclei. Scale bar: 50 µm. Data is presented as mean ± s.e.m. t-test, *P < 0.05.

