
Figure 5.
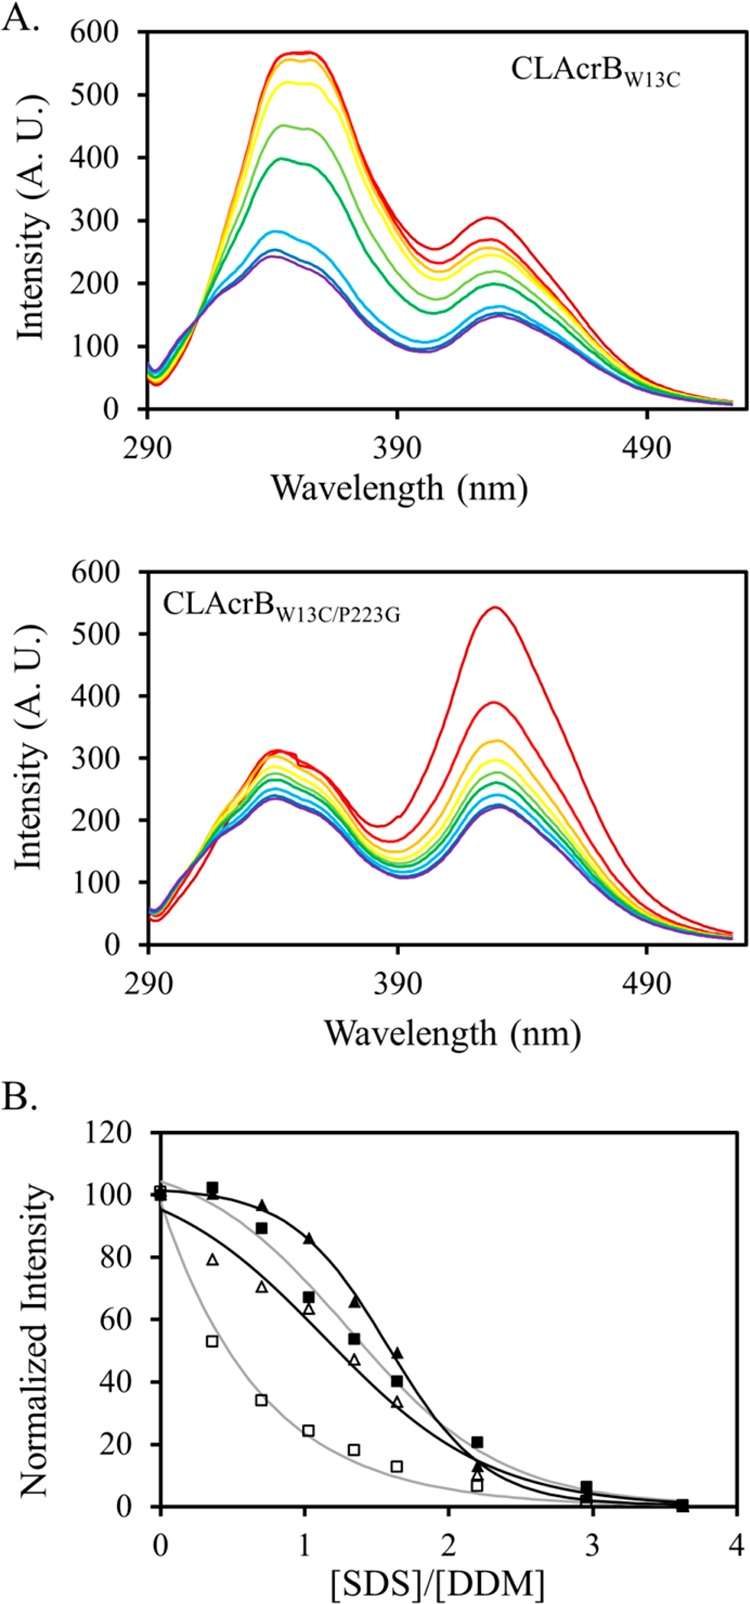
(A) Fluorescence emission of AF350–labeled CLAcrBW13C (top) and CLAcrBW13C/P223G (bottom) excited at 280 nm. The traces are color-coded to shift from red to blue with the increase in the SDS concentration. The two peaks at 345 and 430 nm correspond to the intrinsic fluorescence emission of AcrB and emission from AF350, respectively. Both decrease with the increase in the SDS concentration. (B) Normalized fluorescence intensity of CLAcrBW13C at 345 nm (filled triangles) and 430 nm (open triangles) as well as CLAcrBW13C/P223G at 345 nm (filled squares) and 430 nm (open squares). Although the structure of CLAcrBW13C/P223G began to unfold at a slightly lower SDS concentration than the structure of CLAcrBW13C, the decrease of the FRET efficiency occurred at a much lower SDS concentration for CLAcrBW13C/P223G. The lines are used to illustrate the trend of the data.