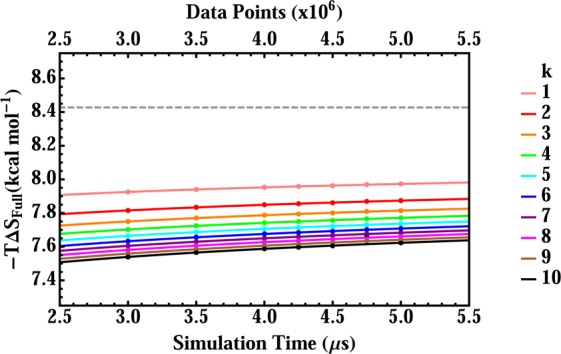
Figure 2.

Convergence of the full-dimensional entropy change, −TΔSfull, for host–guest binding, estimated by the k nearest-neighbor method, as a function of simulation time t. Each data point is the delta entropy estimate between the host and complex for a given value of t and k, and each line is the difference in the host and complex phenomenological fit functions for a given value of k, where the fits for the host and were allowed to approach their own asymptotic values as t → ∞. The fitted values of the exponent p are 0.365 and 0.221, for the host and complex, respectively. The gray horizontal dashed line at −TΔSfull = 8.43 kcal/mol indicates delta in asymptotic values for the host and complex.
