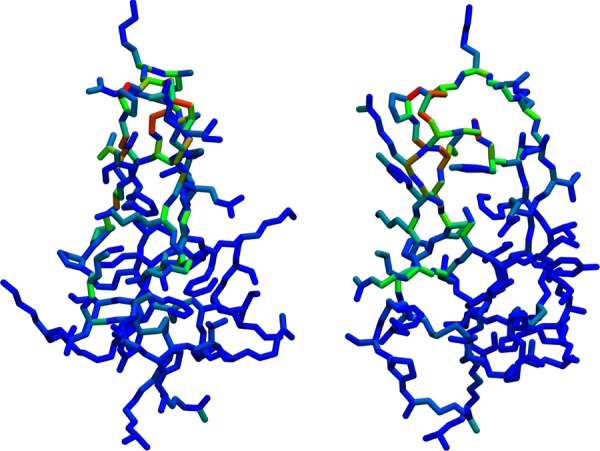
Figure 3.

BPTI, from two viewpoints, with torsions colored based on their Jensen–Shannon divergence metric (JSDM) between Clusters 1 and 2. Dark blue represents the minimum possible divergence of 0.00, and red represents the maximum observed value of 0.75.
