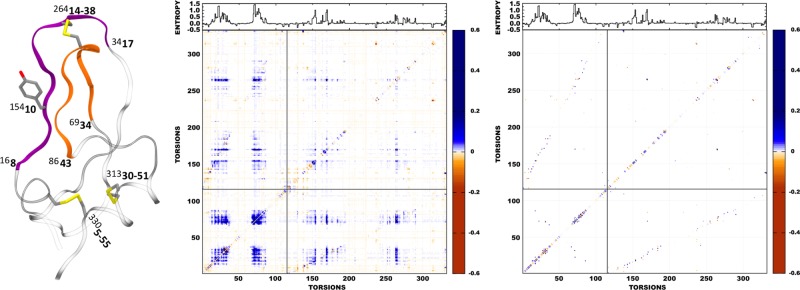
Figure 4.

Structural analysis of the changes in pairwise correlation between Clusters 1 and 2 for torsions throughout BPTI. Left: cartoon representation of BPTI with structural features having large correlation annotated by the torsion number (superscripted) and residue number (bold). Loop 1 (purple) and loop 2 (orange) are connected by the central disulfide bridge (Cys14-Cys38) and show strong intra- and interloop correlation. Center: Mutual information heat map for all torsion pairs pertaining to the 332 nonphase side-chain and main-chain ϕ/ψ torsions. The first 116 torsions correspond to main-chain torsions starting at residue 1, and the following 216 are side-chain torsions, again starting at residue 1. Main-chain torsions of loop 1 start at torsion 16 (residue 8) and end at torsion 34 (residue 17). Main-chain torsions of loop 2 start at torsion 69, residue 34 and end at torsion 86, residue 43. The disulfide bridges are side-chain torsions 264, 313, and 330. Side-chain torsion 154 (Tyr10) shows a noticeable correlation fingerprint. (Right) The corresponding MIST solution for the same set of torsions. The mutual information and entropy values represent Cluster 2 minus Cluster 1 deltas and are reported in units of S/kB. Furthermore, each delta in pairwise mutual information had the average delta in pairwise spurious mutual information (0.0057), as determined by the previous permutation analysis subtracted from its value to minimize numerical bias.
