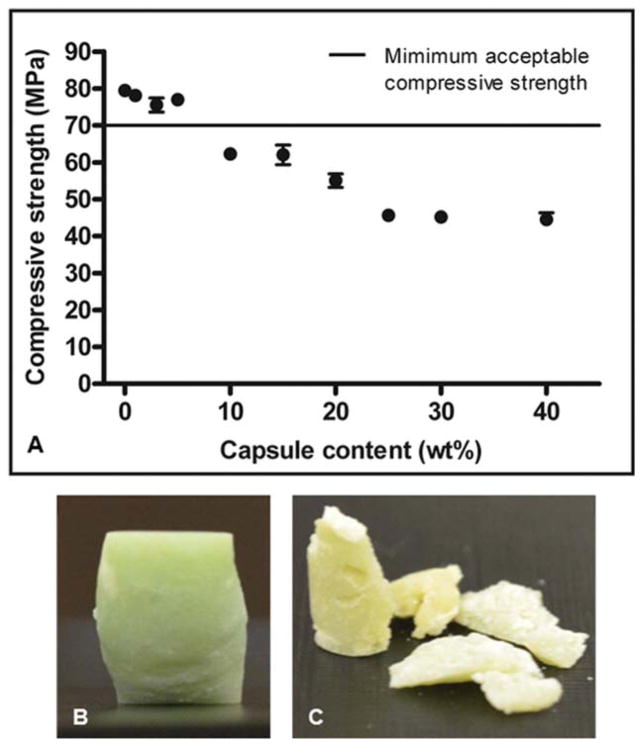
FIGURE 3.
(A) Relationship between capsule content and the ultimate compressive strength of bone cement (average ± SEM, n = 3 with five replicates per group). Photographs of samples containing (B) 0 wt % and (C) 40 wt % capsules postcompression testing. [Color figure can be viewed in the online issue, which is available at wileyonlinelibrary.com.]

