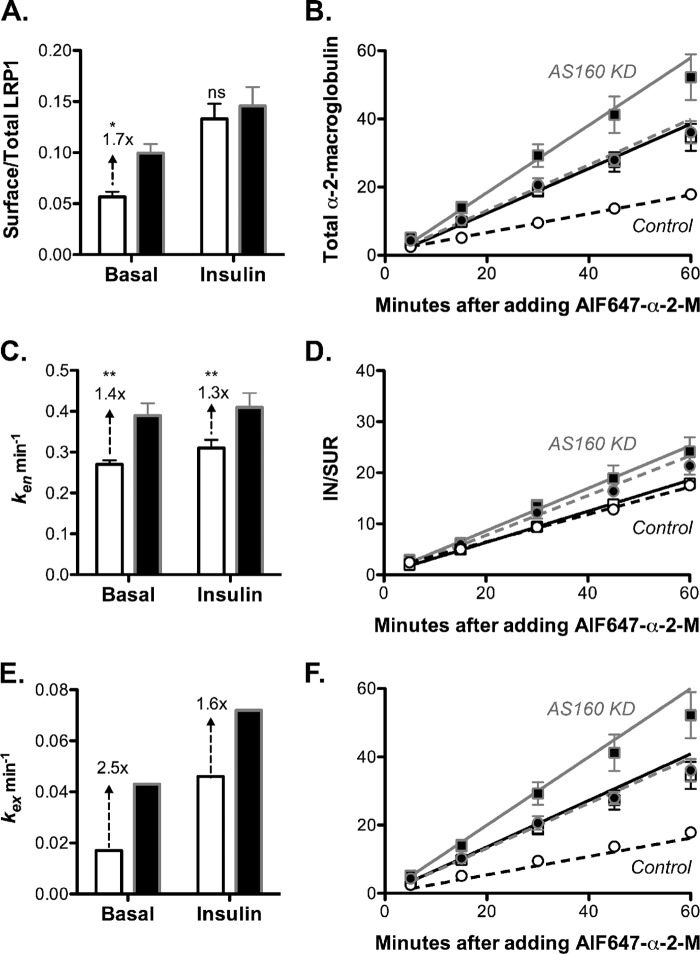
FIGURE 6.
AS160 knockdown in adipocytes increases surface LRP1/α2-M receptor and α2-M uptake by increasing kex in both basal and insulin-stimulated cells. Control adipocytes expressing a nonspecific shRNA (white) or AS160 knockdown adipocytes (black) were treated and analyzed as described in Fig. 5. Data are the average means ± S.D. (error bars) (A and C) or S.E. (error bars) (B) of n = 7 independent experiments. A, surface/total LRP1. Control: basal, 0.06 ± 0.005; insulin, 0.13 ± 0.01. AS160 KD: basal, 0.10 ± 0.009; insulin, 0.15 ± 0.02. B, AF647-α2-M uptake. Lines, linear fits of the data. C and D, endocytic rate constants (ken) were calculated from the slope of the IN/SUR versus time plots (28). Control: basal, ken = 0.27 ± 0.01 min−1; insulin, ken = 0.31 ± 0.02 min−1. AS160 KD: basal, ken = 0.39 ± 0.03 min−1; insulin, ken = 0.41 ± 0.03 min−1. E, estimated exocytic rate constants (kex). Control: basal, kex = 0.017 min−1; insulin, kex = 0.046 min−1. AS160 KD: basal, kex = 0.043 min−1; insulin, kex = 0.072 min−1. F, AF647-α2-M uptake. Lines, simulations (Table 3 and supplemental Fig. 1F). *, p ≤ 0.01; **, p < 0.001, control versus AS160 KD.

