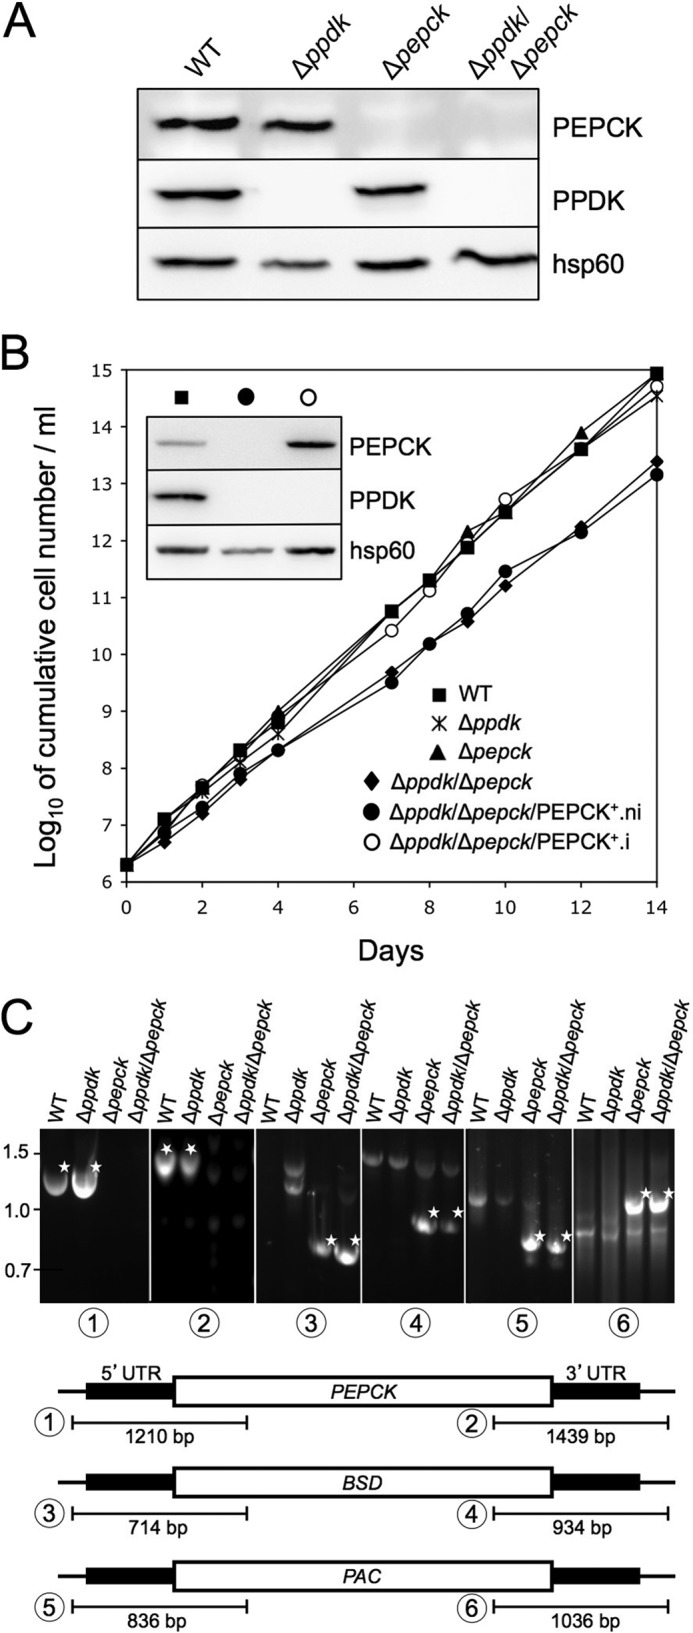
FIGURE 2.

Production of Δppdk, Δppdk/Δpepck, and rescue cell lines. Panel A shows a Western blot analysis of the parental procyclic (WT) and mutant cell lines with the immune sera indicated in the right margin. Panel B shows growth curves of the wild-type (WT), Δppdk, Δpepck, Δppdk/Δpepck, and tetracycline-induced (.i) and uninduced (.ni) Δppdk/Δpepck/PEPCK+ cell lines, as well as a Western blot analysis of the wild-type (■), Δppdk/Δpepck/PEPCK+.ni (●), and Δppdk/Δpepck/PEPCK+.i (○) cell lines with the immune sera indicated in the right margin of the inset. Panel C shows a PCR analysis of genomic DNA isolated from the parental wild-type and Δppdk, Δpepck, and ΔppdkΔpepck cell lines. Amplifications were performed with primers based on sequences that flank the 5′ UTR and 3′ UTR fragments used to target the PEPCK gene depletion (black boxes) and internal sequences of the blasticidin (BSD, PCR products 3 and 4), puromycin (PAC, PCR products 5 and 6) resistance genes and, as controls, the PEPCK gene (products 1 and 2). As expected, PCR amplification of the PEPCK gene was only observed in wild-type and Δppdk cell lines, whereas BSD and PAC PCR products were observed only in Δpepck and ΔppdkΔpepck cell lines. White stars indicate the expected PCR fragment.
