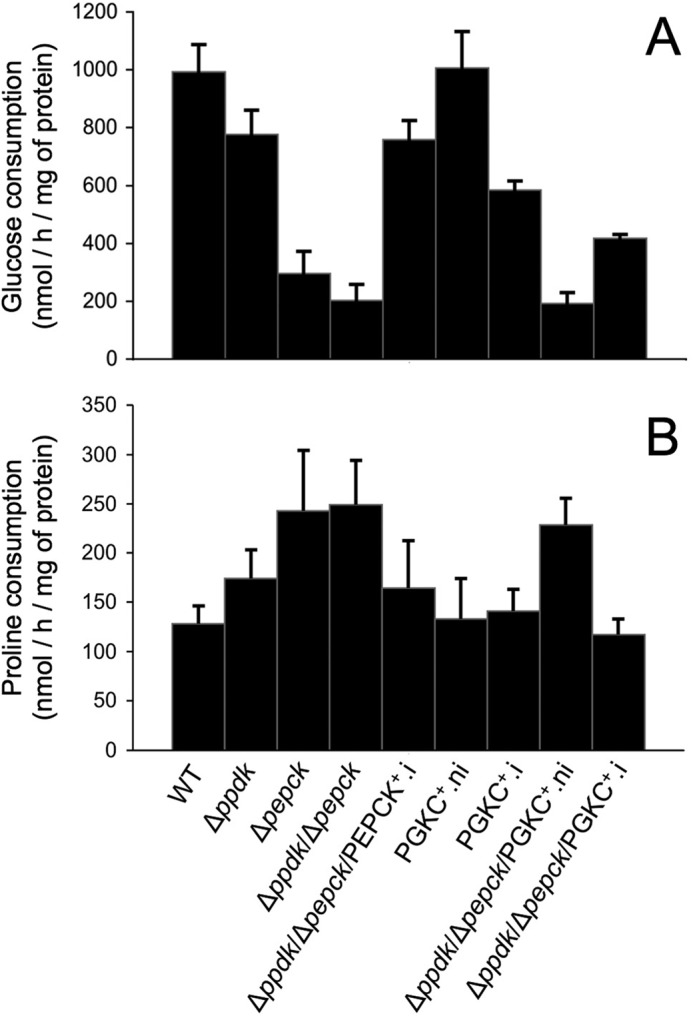
FIGURE 3.

Glucose and proline consumption by wild-type (WT) and mutant cell lines. The rate of glucose (panel A) and proline (panel B) consumed by the indicated cell lines incubated in SDM79 medium is expressed as nanomole consumed per h and per mg of protein. Mean of at least 3 biological replicates are presented.
