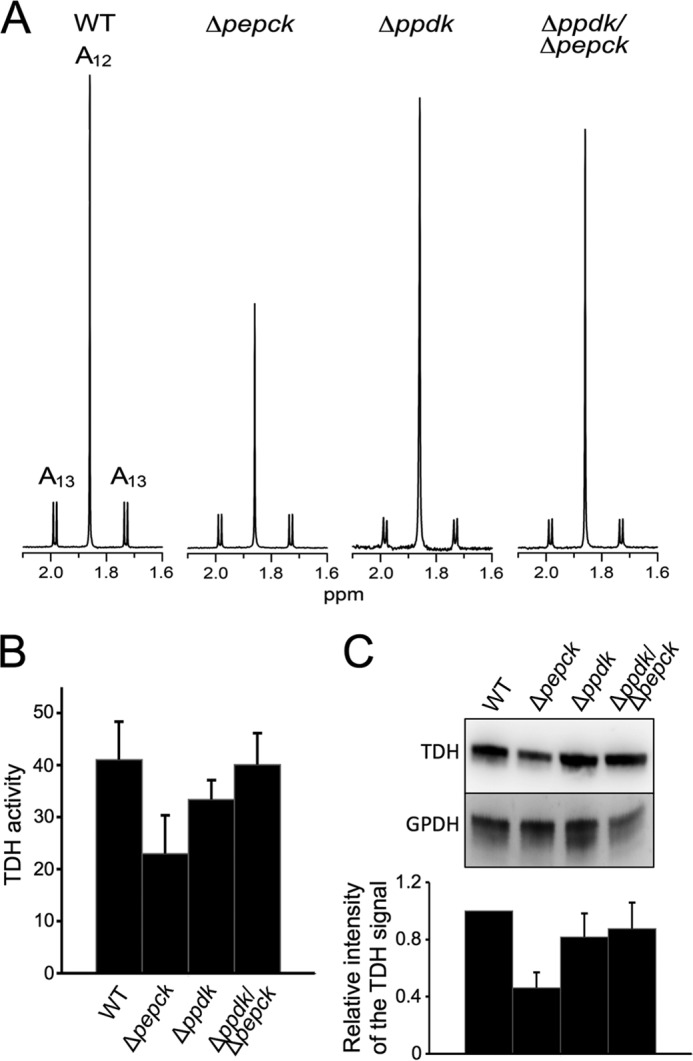
FIGURE 4.

TDH expression and activity are not reduced in the Δppdk/Δpepck cell line. In panel A, contribution of threonine and glucose to acetate production was determined by 1H NMR analysis. Acetate excreted by the procyclic wild-type (WT), Δppdk, Δpepck, and Δppdk/Δpepck cell lines from 4 mm d-[U-13C]glucose and 4 mm threonine was determined by 1H NMR. Each spectrum corresponds to one representative experiment from a set of at least 3. A part of each spectrum ranging from 1.6 to 2.1 ppm is shown. The resonances were assigned as indicated: A12, threonine-derived acetate; A13, 13C-enriched glucose-derived acetate. Panel B shows the TDH activity (milliunits/mg of protein), normalized with the pyruvate dehydrogenase activity measured in the same samples. In panel C, expression of TDH and glycerol-3-phosphate dehydrogenase (GPDH) was analyzed by Western blotting with specific immune sera. The ratio between the TDH and GPDH signals, indicated below the blot, represents a mean ± S.D. of 4 different experimental duplicates, with an arbitrary value of 1 for the parental cells (WT).
