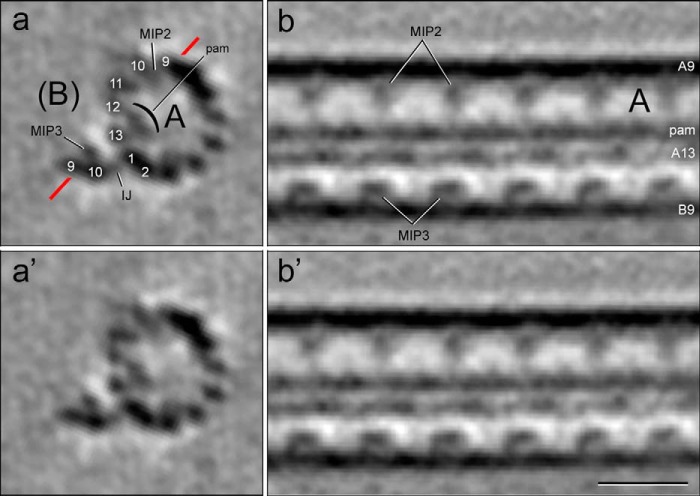
FIGURE 7.
Cryo-electron tomogram of a thermally fractionated, reconstructed, and averaged DMT. Labeled and unlabeled cross-slices (a and a′) and longitudinal slices (b and b′) of an A-tubule with B-tubule hook are shown. Plane of b and b′ is indicated by red line in a. a and a′, viewed from the proximal (minus) end to the distal (plus) end; b and b′, proximal end to the left. Shown are the following: A-tubule (A, with PFs A9 to A2 numbered); MIP2; pam/bracket, partition-associated material; and the remaining portion of the B-tubule (B), including the inner junction component(s) (IJ), PFs B9–10 and MIP3. These markers were used to identify the location of the stable protofilaments A11-12-13-1 (see Fig. 8). Scale bars, a, a′, b, and b′, 20 nm.

