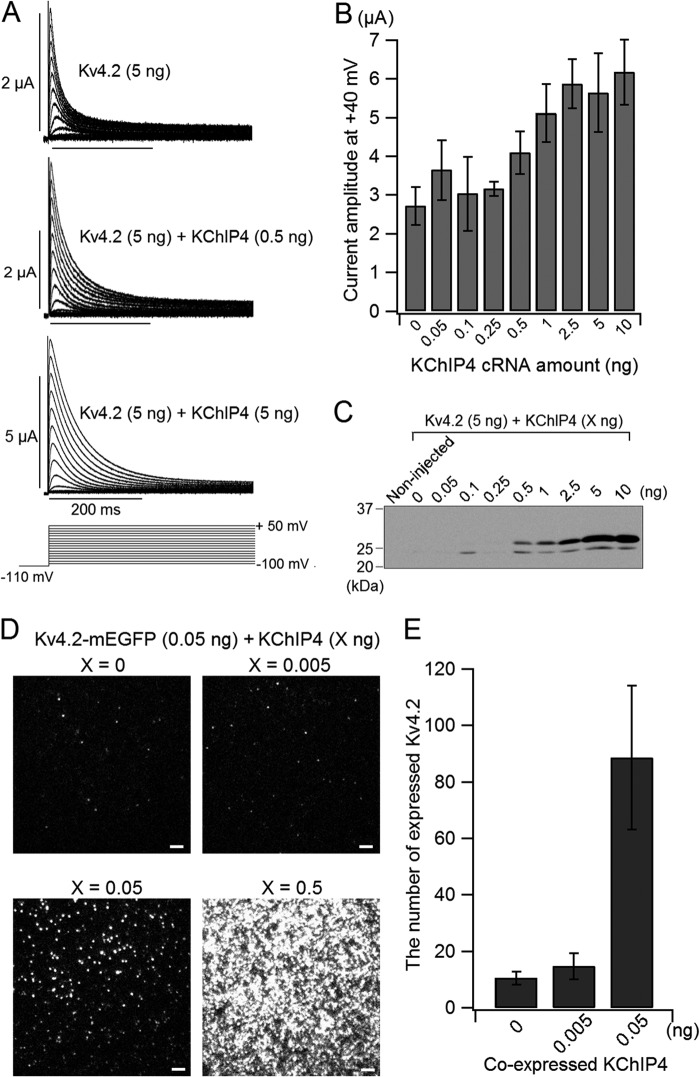
FIGURE 1.
The expression of Kv4.2 gradually changes with increasing co-expression of KChIP4. A, representative current traces of Kv4.2 (5 ng), Kv4.2 (5 ng) with KChIP4 (0.5 ng), and Kv4.2 (5 ng) with KChIP4 (5 ng). The holding potential was at −80 mV. After a 500-ms hyperpolarization at −110 mV to remove the inactivation, the currents were elicited by depolarizing voltage steps for 1 s between −100 and +50 mV in 10-mV increments. Only the current traces of the first 400 ms are shown. B, comparison of the peak current amplitudes of Kv4.2 at +40 mV with various amounts of KChIP4 (n = 6–12). C, dependence of KChIP4 protein expression on the amount of cRNA injected. The different amounts of KChIP4 cRNA (0–10 ng) were injected along with 5 ng of Kv4.2 cRNA into oocytes. Non-injected, oocytes without any injection. D, comparison of the images of Kv4.2-mEGFP expressed on the oocyte surface with various amounts of co-expressed KChIP4 under TIRF microscopy. Each fluorescent spot corresponds to a single tetrameric Kv4.2 channel. Scale bar, 2 μm. E, the numbers of fluorescent spots from Kv4.2-mEGFP are plotted for different amounts of KChIP4 injected (n = 10 for each). Error bars, S.E.

