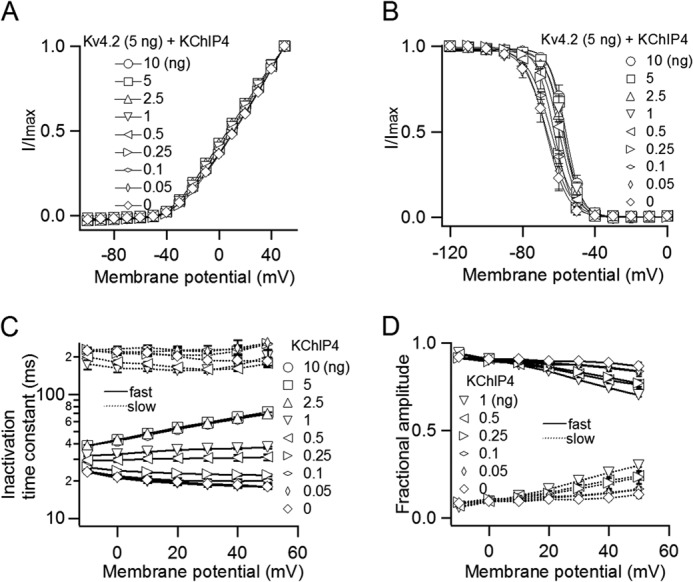
FIGURE 2.

The biophysical properties of Kv4.2 gradually change with increasing co-expression of KChIP4. A, I–V relationships with various amounts of KChIP4. The peak current amplitudes at each potential are normalized to the peak current amplitude at +50 mV (n = 3–13). B, the steady-state inactivation curves of Kv4.2 with various amounts of KChIP4. A 5-s prepulse from −120 to 0 mV in 10-mV increments was applied before a test pulse at +40 mV (n = 3–5). C, voltage dependence of fast and slow inactivation time constants for Kv4.2 with various amounts of KChIP4 (n = 3–13). Slow time constants only are shown for 0–1 ng. D, fractional contributions of the fast and slow inactivation components for 0–1 ng. Error bars, S.E.
