FIGURE 7.
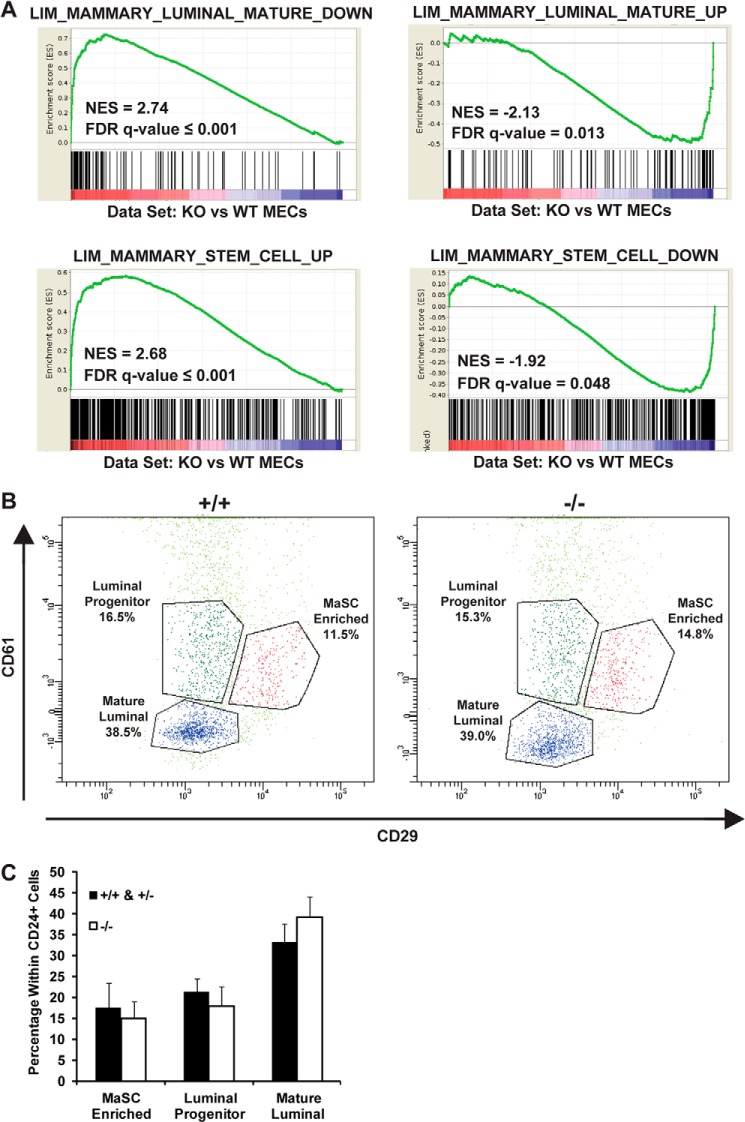
JARID1B loss leads to decreased luminal gene signature and enriched stem cell signature without major changes in cell population. A, GSEA of Jarid1b+/+ and Jarid1b−/− MECs using gene sets differentially expressed in mature luminal cells (top two panels) and mammary stem cell-enriched populations (bottom two panels). NES, normalized enrichment score; FDR, false discovery rate; DOWN, down-regulated; UP, up-regulated. B, flow cytometry analysis of representative Jarid1b+/+ and Jarid1b−/− MECs isolated from females at 7.5 weeks of age. The dot plot shows mature luminal (CD29loCD24+CD61−), MaSC-enriched (CD29hiCD24loCD61+), and luminal progenitor cells (CD29loCD24+CD61+). All cells shown are CD31−CD45−CD24+. C, quantification of each subpopulation in Jarid1b+/+/Jarid1b+/− and Jarid1b−/− MECs. For the combined Jarid1b+/+ and Jarid1b+/− group, n = 3 for Jarid1b+/+ and n = 2 for Jarid1b+/−; for Jarid1b−/−, n = 5. Error bars represent S.E.

