FIGURE 5.
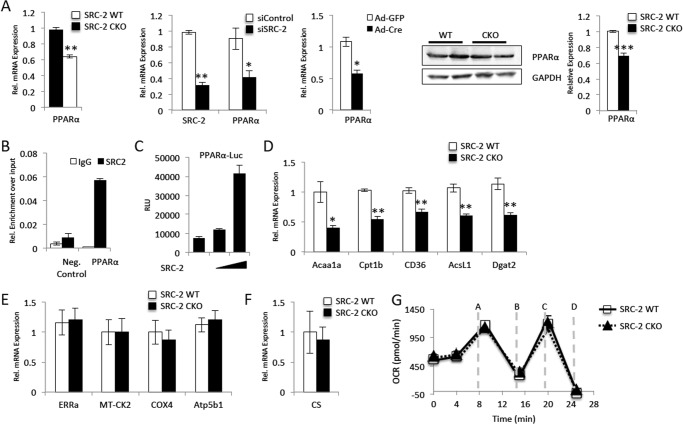
SRC-2 controls PPARα expression. A, qPCR analysis of mRNA expression for the PPARα as described in Figs. 1B and 2, A and D, for analysis of RNA isolated from cardiac-specific SRC-2 KO hearts, siRNA mediated SRC-2 knockdown in H9c2 cells, and Cre-mediated SRC-2 excision in adult primary cardiomyocytes, respectively. Immunoblot analyses of protein expression for PPARα were as described in Fig. 2C. B, ChIP analysis as described in Fig. 2C for the PPARα promoter. C, transactivation assay as described in Fig. 4B for luciferase driven by the PPARα promoter. RLU, relative luciferase units. D–F, qPCR analysis of mRNA expression for the indicated target genes as described in Fig. 1B. F, oxygen consumption rates (OCR versus time) of mitochondria isolated from WT and SRC-2 CKO hearts. Oxygen consumption rate was performed on the Seahorse XF24 analyzer. Injections were at the times indicated as follows: A, ADP; B, oligomycin (ATP coupler); C, FCCP (electron transport chain accelerator); and D, antimycin A (complex III inhibitor). Statistical analysis was performed with Student's t test where * = p ≤ 0.05, ** = p ≤ 0.01, and *** = p ≤ 0.001.

