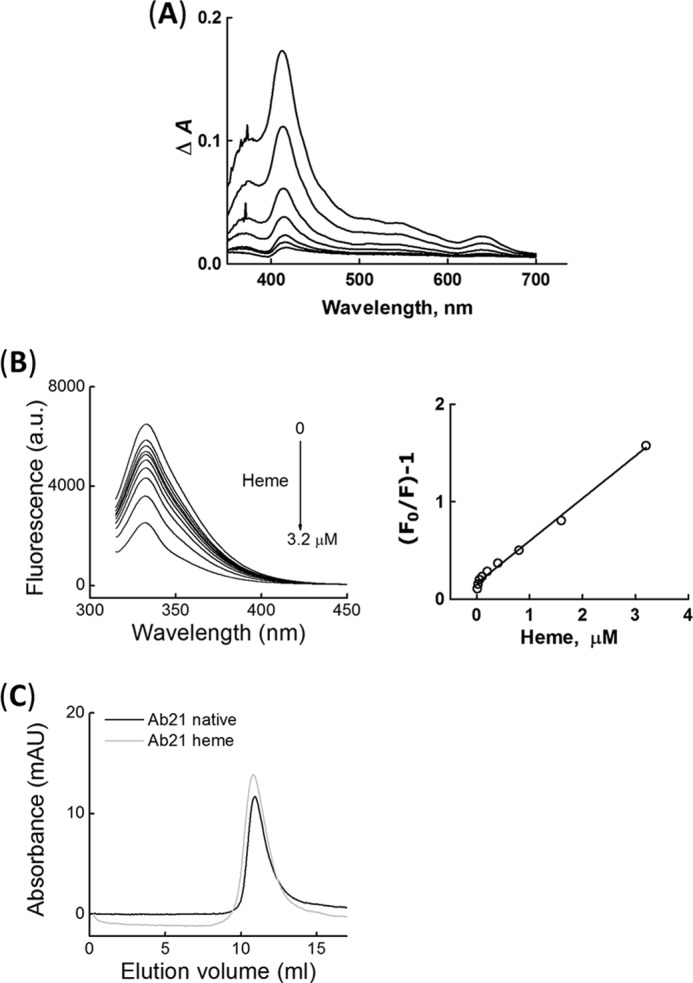
FIGURE 2.

Characterization of heme binding to Ab21. A, differential spectra of heme obtained by absorbance spectroscopy after titration of 1 μm Ab21 with increasing concentrations of heme (0.25–16 μm). Differential spectra were obtained after subtraction of spectra of heme in PBS from the spectra of identical concentrations of heme in the presence of Ab21. B, quenching of tryptophan fluorescence of Ab21 by heme. Left panel, emission spectra of Ab21 (0.1 μm) obtained after titration with increasing concentrations of heme (0–3.2 μm). Right panel, Stern-Volmer plot that depicts the quenching of tryptophan fluorescence by increasing concentrations of heme. C, size-exclusion chromatography. Elution profiles of 1 μm native Ab21 (black line) and 1 μm Ab21, exposed to 10 μm heme (gray line).
