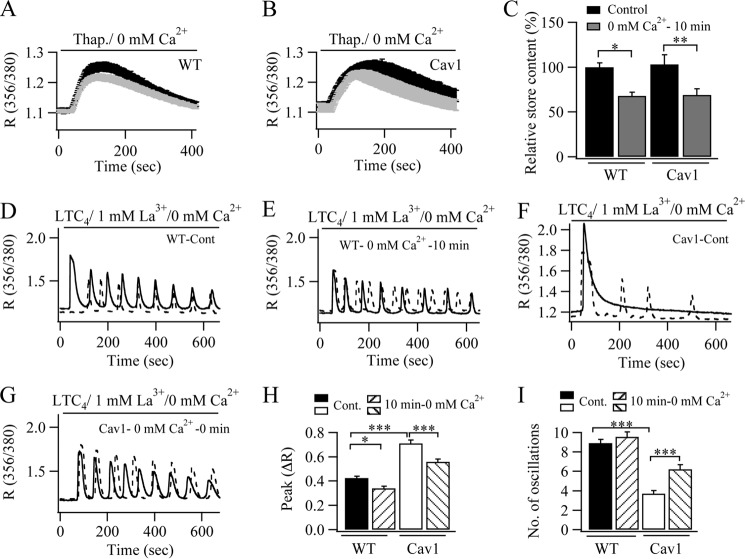
FIGURE 6.
Reducing the Ca2+ content of the stores prior to stimulation reduces the rundown of Ca2+ oscillations in caveolin-1-GFP (Cav1)- expressing cells. A, preincubation in Ca2+-free solution reduces the store Ca2+ content, as assessed by the extent of Ca2+ release to thapsigargin. The black trace is control (∼30 s in Ca2+-free solution). The dotted trace is the response after 10 min in Ca2+-free solution. Each trace represents the average of 15–35 cells from four independent experiments. B, same as in A, but for cells expressing caveolin-1. C, aggregate data from several recordings as in A and B are summarized. D, typical oscillatory responses to LTC4 obtained in Ca2+-free solution containing La3+. In each of the panels D–G, two cells (solid line and dotted line) treated the same way but from two different preparations are shown. E, typical oscillatory responses after preincubation in Ca2+-free solution for 10 min. F, oscillatory responses to LTC4 in cells expressing caveolin-1. G, oscillatory responses to LTC4 in caveolin-1-expressing cells after pre-exposure to Ca2+-free solution for 10 min. H, the amplitude of the first oscillation for each condition is shown. I, the average numbers of oscillations obtained over 600 s for each condition are compared. Each bar represents between 15–38 cells from three independent experiments. **, p < 0.01; ***, p < 0.001.

