FIGURE 3.
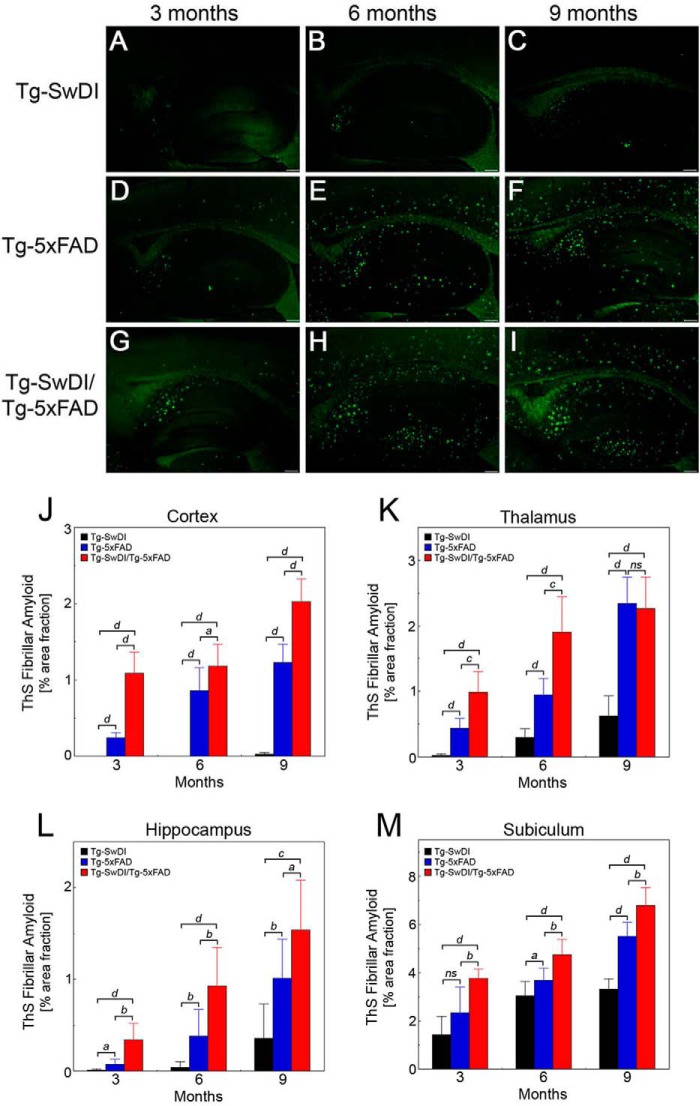
Progressive accumulation of fibrillar amyloid deposition in Tg-SwDI, Tg-5xFAD, and bigenic Tg-SwDI/Tg-5xFAD mouse brains. Shown are representative images of 3- to 9-month-old transgenic mouse brain sections stained for fibrillar amyloid using thioflavin S (green) as described under “Experimental Procedures.” A–C, Tg-SwDI mice. D–F, Tg-5xFAD mice. G–I, bigenic Tg-SwDI/Tg-5xFAD mice. Scale bars = 1 mm. Regional fibrillar amyloid deposition in the cortex (J), thalamus (K), hippocampus (L), and subiculum (M) of 3-, 6-, and 9-month-old Tg-SwDI mice (black bars), Tg-5xFAD mice (blue bars), and bigenic Tg-SwDI/Tg-5xFAD mice (red bars) was determined by image analysis of thioflavin S staining. Data are mean ± S.D. of eight mice of each genotype at each age. a, p < 0.05; b, p < 0.01; c, p < 0.001; d, p < 0.0001; ns, not significant.

