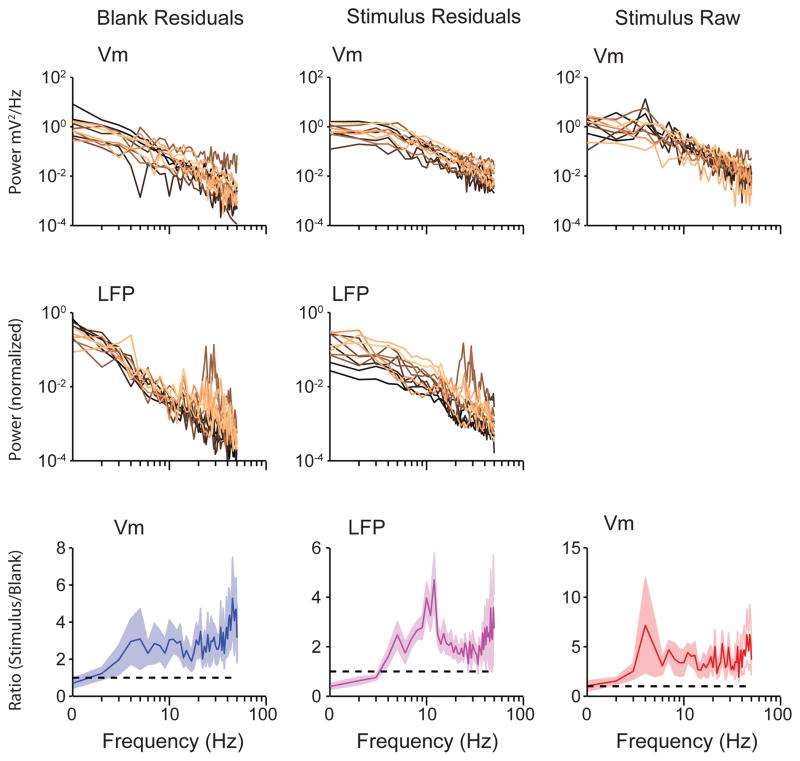
Extended Data Figure 6. Power spectra of Vm and LFP fluctuations from the trial average.
Power spectrum of Vm (top panels) and LFP (bottom panels) fluctuations from the trial average (residuals) during blank trials (left panels) and preferred orientation (right panels) for each recorded neuron. b, Population-averaged ratio of power spectrum at the preferred orientation to power spectrum for blank trials for raw Vm (top panel), Vm fluctuations from the trial average (‘Vm residuals’, middle panel), and LFP fluctuations from the trial average (‘LFP residuals’, bottom panel). Error bars are jackknifed standard errors.

