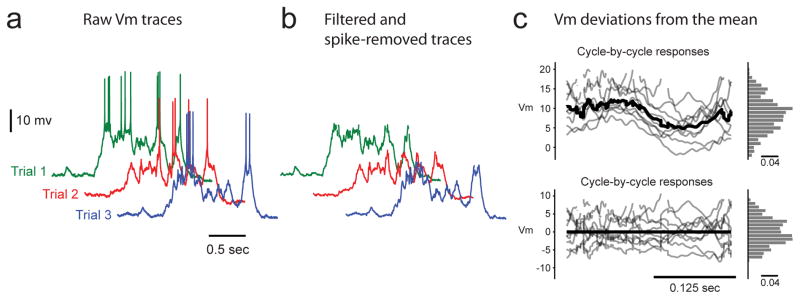
Extended Data Figure 3. Estimation of Vm skewness during visual stimulation trials.

a, Raw traces from several trials. b, Traces after bandpass filtering and spike removal. c, Vm responses from each cycle (top grey traces), cycle-averaged response (top black trace), and histogram of Vm responses (top histogram); residual traces from each cycle after subtraction of cycle-averaged response (bottom grey traces), cycle-averaged residuals (bottom black trace), and histogram of Vm residuals (bottom histogram); note the change in vertical scale from top to bottom panels.
