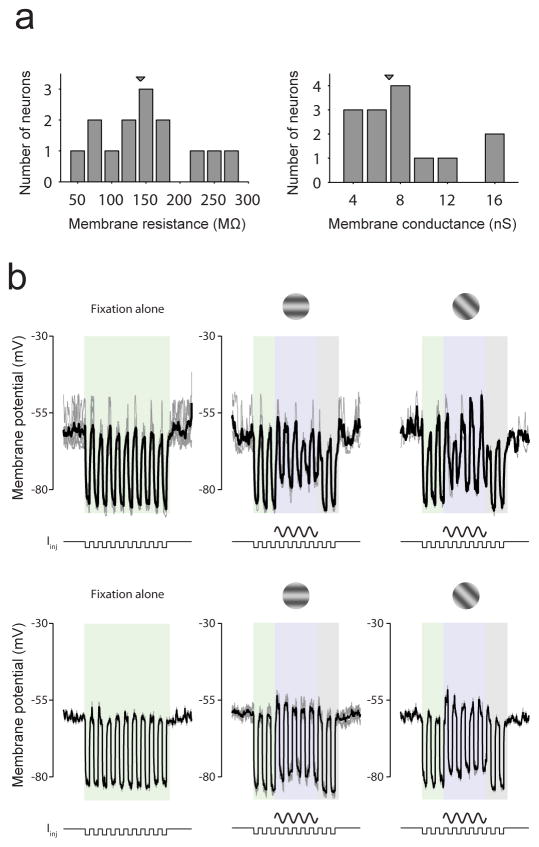
Extended Data Figure 5. Membrane conductance during blank and visual stimulation trials.
a, Distribution of membrane resistance (left) and corresponding membrane conductance (right) during blank trials. b, Change in membrane conductance during visual stimulation in 2 example neurons during blank (left), preferred (centre) and 45° from preferred (right) trials. Each row shows data from a different neuron.

