
Figure 1.
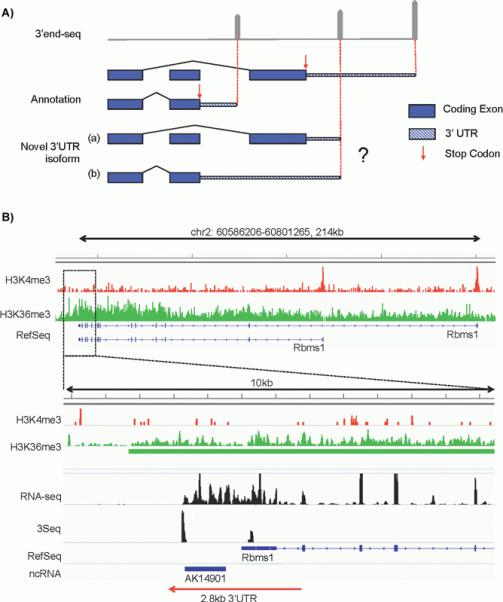
Strategies to map novel polyadenylation sites to primary transcripts. A: Example of potential difficulties in mapping a 3′ end-seq peak to primary transcripts when splicing-dependent isoforms are involved. Gene annotation indicates two 3′UTR isoforms with different stop codon (proximal and distal, red arrows) on different exons. In the top panel, gray pointed bars indicate 3′ end-sequencing peaks. The most proximal and distal peaks match the annotation, however the novel peak that resides in the middle can be interpreted as a shortened 3′UTR using the distal stop codon as shown in (a) or an extended 3′UTR using the proximal stop codon as shown in (b). B: Example of utilizing Histone ChIP-seq data to facilitate 3′UTR annotation. Top panel shows gene structure of Rbms1, which is an example with an extended 3′UTR reported by Miura and colleagues. ChIP-seq of H3K4me3 (red track) demarcates transcription start site (TSS). The two prominent peaks match the two annotated transcription start sites. H3K36me3 (green track) demarcates active Pol II elongation with preferable signal towards the 3′ end. A zoom in of a 10 kb region of the 3′ end is shown in the bottom panel, where a long non-coding RNA (AK14901) was annotated previously [19]. No H3K4me3 peaks are detected for the novel transcript whereas strong H3K36me3 signals extend from the RefSeq annotated Rbms1 3′UTR region and cover the entire region of AK14901, indicating that this non-coding RNA is likely an extended 2.8 kb 3′UTR. This conclusion is supported by 3′ end-seq profiling data (3Seq, data from [13]) and full-length RNA-seq (unpublished data).