
Fig. 5.
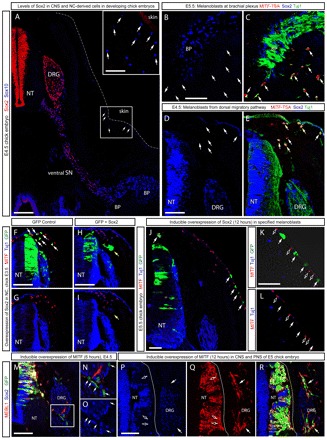
Sox2 and Mitf cross-regulatory interactions during melanocyte development in chick. (A) Cross-section through the forelimb level of E4.5 chick embryo stained for Sox2 (red) and Sox10 (blue). Boxed area is enlarged in inset. Note the lack of Sox2 expression in Sox10+ cutaneous melanocytes (arrows) and the gradual reduction of Sox2 in more distal parts of the ventral spinal nerve. (B,C) Mitf, Sox2 and Tuj1 staining of the brachial plexus. Sox2+ is observed in SCP whereas Mitf+ melanoblasts lack Sox2 (arrows). (D,E) Mitf, Sox2 and Tuj1 staining of the dorsal neural tube. Note the lack Sox2 immunoreactivity in the nuclei of NCC-derived Mitf+ cells (arrows) at E4.5. (F-I) NC overexpression of Sox2 and GFP in the chick. GFP labels overexpressing cells. In control GFP-overexpressing embryos, GFP labeled cells are observed among melanoblasts (Mitf+ cells) and the DRG (arrows). Sox2 expression leads to loss of GFP+/Mitf+ cells (white arrows) and ectopic ganglia-like formations (yellow arrows). (J-L) Inducible overexpression of Sox2 and GFP at E5.0 in the chick with analysis 12 hours later. Non-overexpressing melanoblasts (i.e. GFP– cells) contain Mitf (unfilled arrows) whereas GFP+ cells completely lack Mitf immunoreactivity (filled arrows). (M-O) Inducible overexpression of Mitf for 6 hours caused significant repression of Sox2 in targeted (GFP+) cells (arrows) in CNS and PNS, and weak ectopic Mebl1 expression in spinal cord. N and O are high magnification images of the boxed area in M. (P-R) Inducible overexpression of Mitf for 12 hours caused a complete loss of Sox2 in targeted cells in CNS (unfilled arrows) and PNS (filled arrows) (P). Ectopic expression of Mebl1 was observed in overexpressing (GFP+) cells (Q). Dotted line outlines the neural tube. BP, brachial plexus; SN, ventral spinal nerve; NT, neural tube. Scale bars: 150 μm in A; 70 μm in A, inset; 50 μm in B,C; 100 μm in D-R.