
Fig. 7.
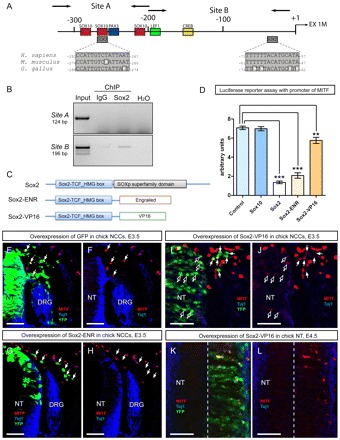
Sox2 regulates the activity of Mitf-m proximal promoter. (A) Structure of Mitf-m proximal promoter with predicted binding sites. Arrows show the positions of primers used to amplify site A and site B in ChIP assay with Sox2 antibody. (B) PCR reaction demonstrating binding of Sox2 on the proximal Mitf-m promoter in ChIP assay. (C) Domain structure of Sox2 and Sox2-activating and -repressing fusion proteins used for overexpression experiments in vitro and in vivo. (D) Luciferase reporter assay in melanoma cells with endogenous Mitf-m promoter activity (control, n=16 vs: Sox2, n=8, ***P<0.0001; Sox2-ENR construct, n=8, ***P<0.0001; Sox2-VP16 construct, n=4, **P=0.0038). (E-L) In vivo effects of Sox-ENG and Sox2-VP16 on melanocyte development 2 days after electroporation in chick. Arrows in E,F,I,J show GFP+/Mitf+ migratory cells and in G,H, all GFP+ cells. Solid arrows show NCC-derived cells, whereas open arrows point to cells in the neural tube. (K,L) Dashed line separates two halves of a neural tube. Note the presence of nuclear Mitf (red) in GFP+ cells of the electroporated half. NT, neural tube. Scale bars: 100 μm.