
Fig. 5.
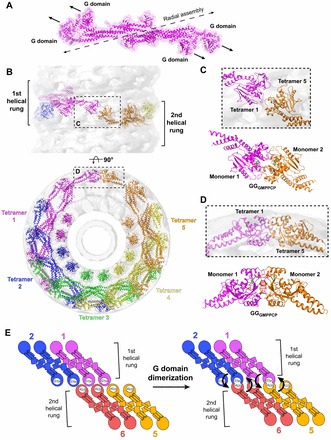
Structural constraints of G domain dimerzation. (A) Membrane-bound conformation of the dynamin tetramer (magenta). The dashed black line illustrates the axis of radial assembly within a helical rung. The arrows depict the relative orientation of the G domains within the tetramer. Note that the G domains do not form productive head-to-head interactions required for G domain dimerization. (B) Pseudoatomic model of the dynamin polymer generated by computationally docking crystallized dynamin domain structures into the GMPPCP-stabilized ΔPRD cryo-EM map (gray). The numbering and rainbow coloring (magenta to orange) denotes the sequential addition of tetramers to the assembly and terminates when the first G domain dimer is formed between magenta tetramer 1 and orange tetramer 5. The upper panel depicts a side view perpendicular to the helical axis; the lower panel is an end view looking down this axis. The sequential rungs of the dynamin helix are marked in the upper panel with black brackets. The areas indicated by the black boxes (see C and D) highlight that G domain dimerization only occurs between tetramers in adjacent helical rungs. (C,D) Magnified top (C) and side (D) views of G domain interactions within the assembled dynamin polymer. The crystallized GGGMPPCP dimer (monomers colored magenta and orange) is shown below each for comparison. (E) Illustration of G domain dimerization in the context of the helical polymer. Tetramers are colored and numbered as in B. Arrows denote the direction of the hydrolysis-dependent BSE conformational change that would accompany stimulated GTP hydrolysis in each G domain dimer pair.