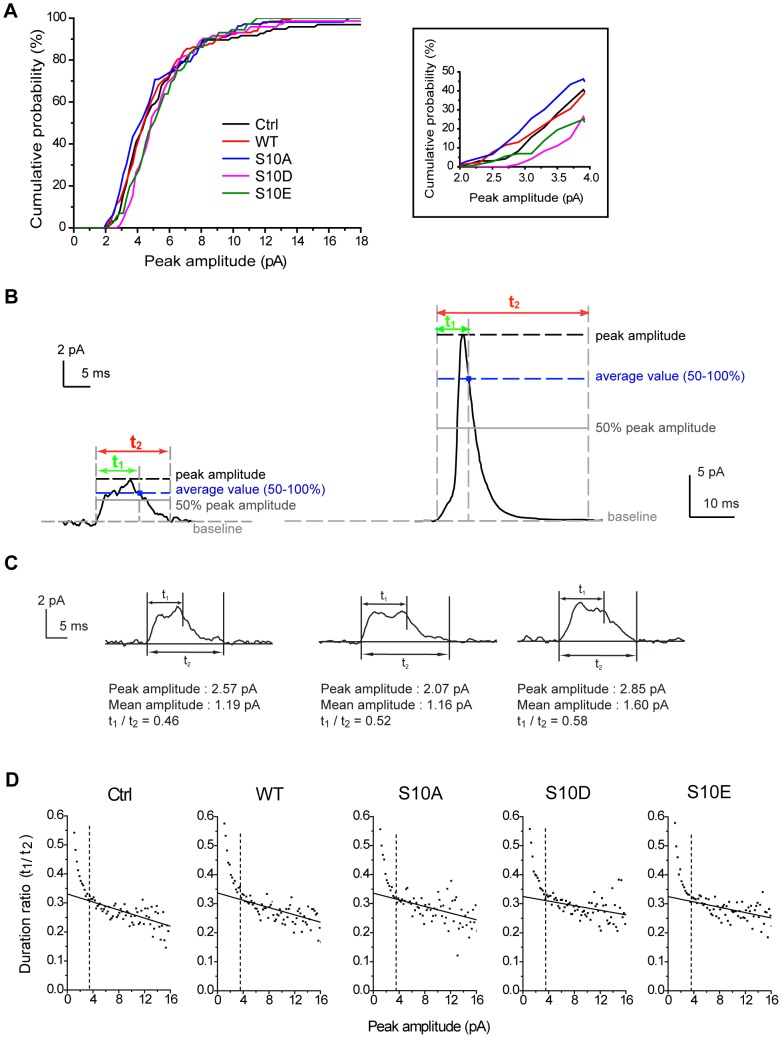
Figure 3. Two types of fusion events in cells overexpressing CSP and its phosphomutants.
A, Cumulative probability of peak amplitudes for all events ≥2 pA. Inset, expanded view of this cumulative probability in the 2 to 4 pA amplitude range. B, Representative traces of kiss-and-run (KR) (left) and full-fusion (right) events. Two durations distinguish KR from full-fusion events. Duration t1 (green) represents the duration from signal onset to when the signal falls back to the average value above the 50% peak amplitude. Duration t2 (red) represents the duration from onset to when the signal returns to within 1×RMS noise of the baseline. Black dashed lines, the peak amplitude of the event. Gray solid lines, 50% of peak amplitude. Blue dashed lines, the average value of the data within 50–100% peak amplitude. Gray dashed lines, baseline (horizontal) or the time boundaries (vertical) for duration t1 or t2. Blue squares, the end point of duration t1. C, Peak amplitudes, mean amplitudes, and duration ratios can be obtained from individual KR events. D, Scatter plots of duration ratios (t1/t2) vs. peak amplitudes for events in all groups (n = 5583–9198 events). Duration ratios were averaged for events with peak amplitudes in the same bin and plotted versus peak amplitude (Note that we acquired all signals with the peak amplitude ≥1 pA here). Solid lines indicate the linear fits for the events with peak amplitude >3.5 pA. Dashed lines indicate the transition point (3.5 pA of peak amplitude) between the solid lines and the rising phase of the data.

