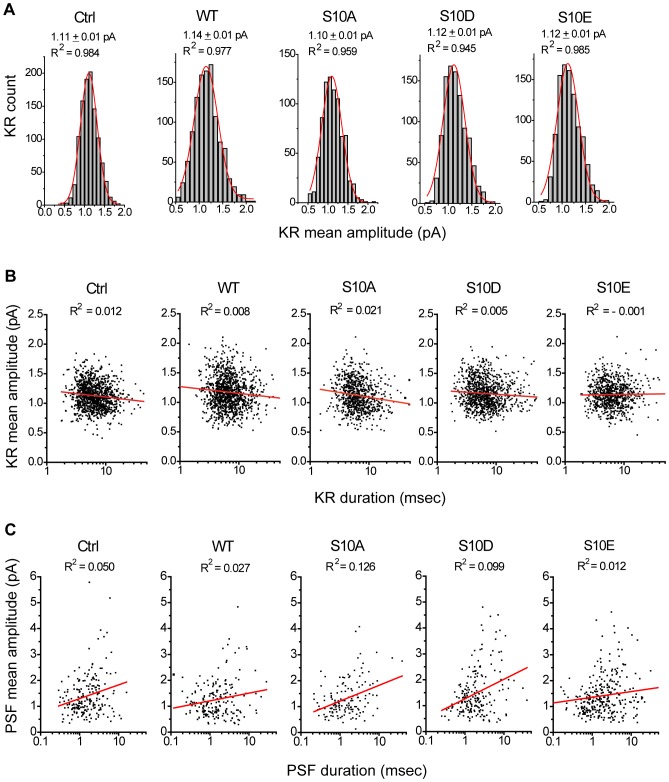
Figure 4. KR events in cells overexpressing CSP and its phosphomutants.
A, Mean amplitude histograms of KR events fitted by Gaussian distributions (red) for all groups. The mean values and R2 from Gaussian distributions were as indicated. B, Scatter plots of mean amplitudes vs. durations for KR events. The R2 from linear regression (red) were as indicated. For A and B, n = 797–1112 events. C, Scatter plots of PSF mean amplitudes vs. durations. The R2 from linear regression (red) were as indicated. Total 105–242 PSF events.

