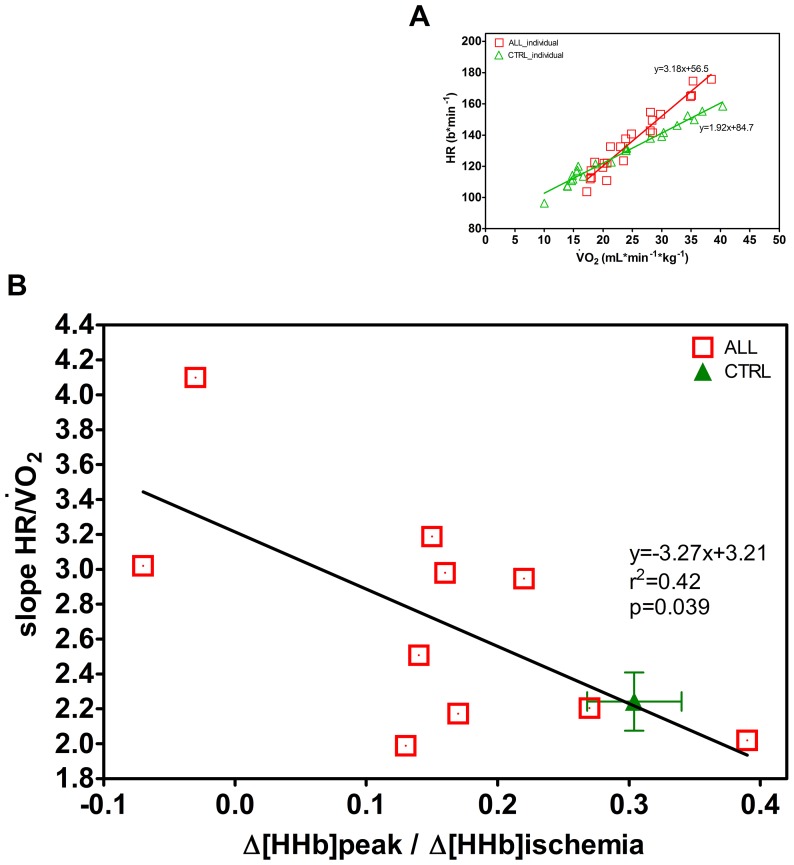
Figure 5. Individual regression for heart rate (HR) vs the corresponding  for one ALL and one CTRL child (A graph).
Regression between the individual slopes of the HR vs
 relationship, obtained in children with ALL (n = 10) and skeletal muscle O2 extraction at peak of exercise Δ[HHb]peak, expressed as the ratio of the values obtained during limb ischemia with the corresponding regression line (B graph). CTRL values are given as mean±SE. Statistical significance level was defined as p<0.05.

