
Fig. 2.
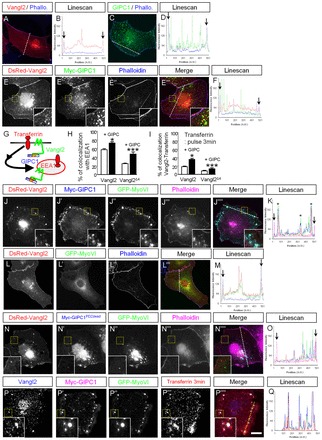
Vangl2 and Gipc1 colocalize in endosomal vesicles that are redistributed peripherally by MyoVI. (A-F) Immunofluorescence microscopy of COS-7 cells transiently transfected with DsRed-Vangl2, myc-Gipc1 or a combination of the constructs, and labeled with phalloidin (blue), with a line scan corresponding to the dashed line for each condition. The arrows on the line scans represent cell boundaries labeled by phalloidin (A-D). Single expression of DsRed-Vangl2 (red) or myc-Gipc1 (green) led to vesicular, membrane and perinuclear staining. (E-F) DsRed-Vangl2 and myc-Gipc1 colocalize in cytoplasmic vesicles, clusters and at the plasma membrane. (G) Schematic of the localization of transferrin and Eea1 in early endosomes containing Vangl2. (H) Sixty percent of GFP-Vangl2 vesicles colocalized with Eea1-labeled vesicles. This colocalization is increased in the presence of myc-Gipc1, and severely impaired by removal of the PDZ-BM of Vangl2 (Vangl2Δ4). (I) Similar profiles are observed when we measured colocalization of Vangl2-positive vesicles with fluorescent transferrin after a 3-minute treatment. (J-K) DsRed-Vangl2, GFP-MyoVI and myc-Gipc1 co-expression leads to an almost complete colocalization of the three proteins, with a re-localization of these clusters close to, but not at, the plasma membrane (magenta). Note on the line scan (K) that the peaks with high Vangl2 intensity (asterisks) do not correspond to the plasma membrane peaks (arrows). (L-M) DsRed-Vangl2 and GFP-MyoVI are expressed in the cytoplasm, in vesicle-like cytoplasmic punctae, weakly at the membrane and in the perinuclear region of the cell. (N-O) A mutation in the PDZ domain of Gipc1 (myc-Gipc1PDZdead) prevents the formation of the clusters and their re-localization. Note the presence of Vangl2 at the membrane (inset). (P-Q) A short treatment (3 minutes) with Alexa Fluor568-conjugated transferrin (red) reveals colocalization with the clusters. Insets show magnifications of boxed area within the same panel. *P≤0.05, **P≤0.01, ***P≤0.001. Error bars represent the standard error of the mean of triplicates. Scale bar: 15 μm.