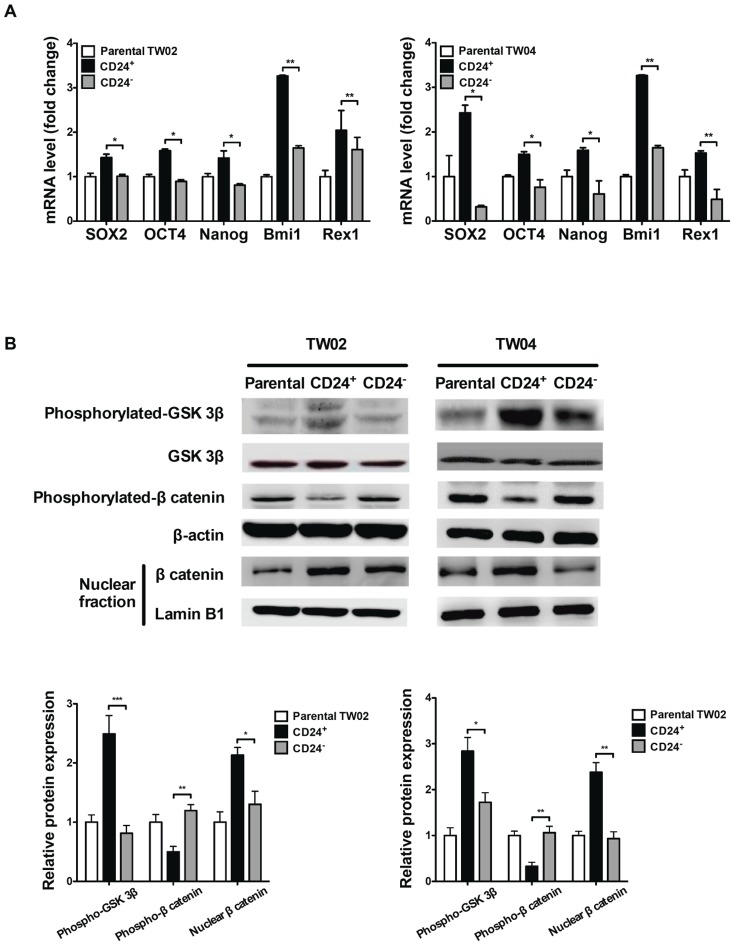
Figure 2. Expression levels of stem cell genes and activation of the Wnt/β-catenin pathway in CD24+ cells.
(A) mRNA expression levels of Sox2, Oct4, Nanog, Bmi-1 and Rex-1 in parental, CD24+ and CD24− cells from the NPC cell lines, TW02 (left) and TW04 (right), was evaluated using quantitative RT-PCR analysis. The results shown represented the average of three independent experiments. *: p<0.05, **: p<0.01. (B) Western blots analysis of phosphorylated-GSK, GSK, phosphorylated-β-catenin, β-catenin and β-actin in whole cell lysates, and of β-catenin and lamin B1 in nuclear fractions of parental, CD24+, and CD24− cells isolated from the TW02 and TW04 cell lines. Quantitative result was calculated by ImageJ software. *: p<0.05, **: p<0.01, ***: p<0.001.

