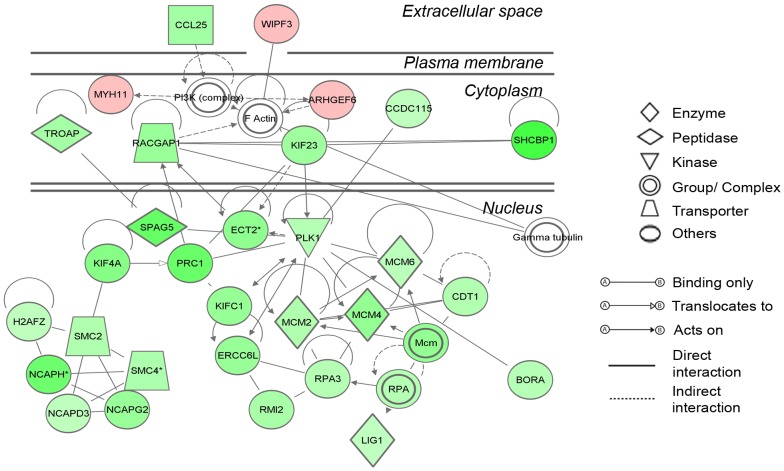
Figure 4. The most significant network determined in IPA.
The network was generated in IPA using triangle connectivity based on focus genes (30 from our differentially regulated data set) and built up according to the number of interactions between a single prospective gene and others in the existing network, and the number of interactions the prospective gene has outside this network with other genes as determined by IPA [43]. Network score = 52, equivalent to −log P value of Fisher's exact t-Test. Interactions between molecules, and the degree and direction of regulation are indicated with up (red) or down regulation (green) and increasing color intensity with degree of fold change.

