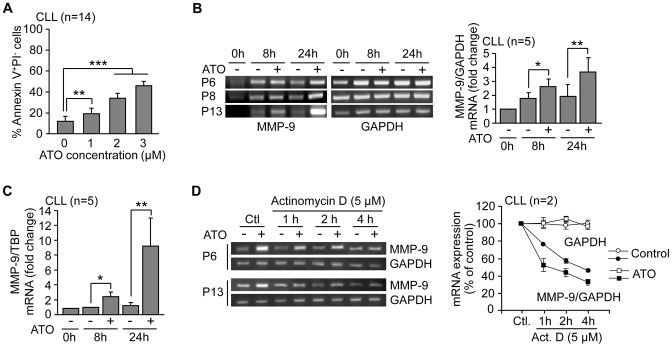
Figure 1. ATO transcriptionally upregulates MMP-9 in CLL cells.
(A) 1.5×10⁵ CLL cells in RPMI/0.1%FBS were incubated with or without the indicated concentrations of ATO. After 24 h, cells were analyzed by flow cytometry using FITC-Annexin V and PI. (B) 10–15×106 CLL cells were treated with 3 µM ATO for the indicated times and MMP-9 mRNA expression was analyzed by RT-PCR, using GAPDH mRNA as internal control. Normalized average values (fold change) are shown. (C) The same mRNA samples were also analyzed by qPCR using TBP as internal control and normalized average values (fold change) are shown. (D) 10–15×106 CLL cells were cultured with or without 3 µM ATO for 20 h. Cells were then treated or not (Control, Ctl) with 5 µM actinomycin D and mRNA expression was analyzed at the indicated times. Values represent the average MMP-9/GAPDH ratio from the two samples after normalizing control values to 100. Values for GAPDH mRNA are also shown. *P≤0.05; **P≤0.01; ***P≤0.001.

