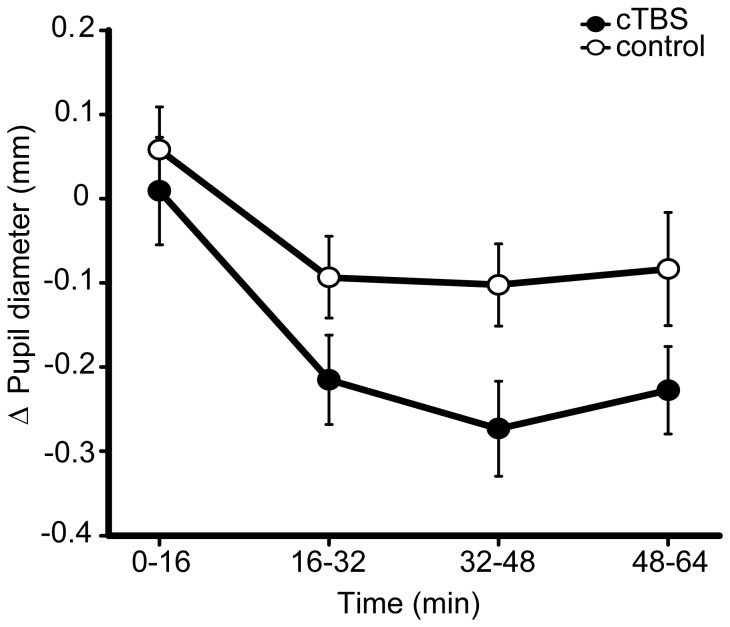
Figure 3. Experiment 1 – pupillometry results.
Change in pupil diameter from the pre-TBS baseline, following cTBS and control conditions, over the course of the experiment. cTBS vs. control p = 0.17, B(cTBS>sham) = 0.231, where prior is based upon behavioural effect across experiments (this prior is used in all subsequent Bayesian statistics described in figure legends, unless otherwise stated). Error bars are ±1 SEM.

