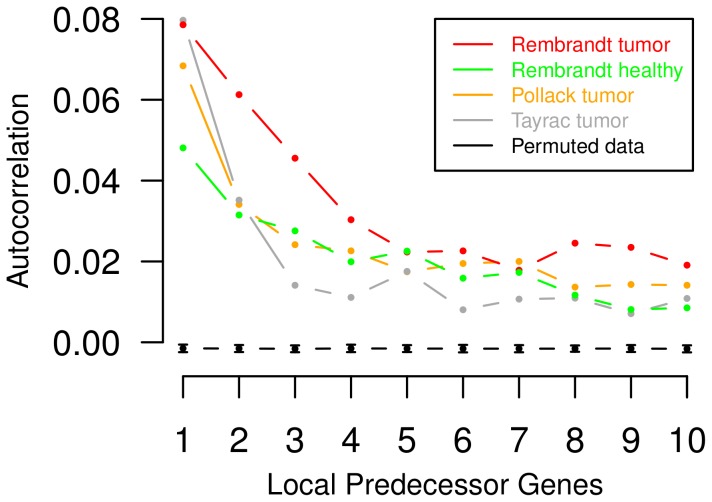
Figure 1. Local chromosomal dependencies of gene expression levels in different types of cancer.
Spatial correlations of expression levels of genes in increasing chromosomal order up to ten were quantified by an average autocorrelation function that considers each chromosome-specific expression profile in each individual tumor sample. The autocorrelation function quantifies the similarity of gene expression levels of neighboring genes on a chromosome in a fixed distance. Corresponding average autocorrelation functions are shown for three types of cancer (i) different types of gliomas (red) [33], (ii) breast cancer expression profiles (orange) [3] and (iii) glioblastoma expression profiles (grey) [4]. Additionally, the green curve represents the average autocorrelation function of normal brain reference gene expression profiles taken from [33]. Due to chromosomal aberrations in gliomas, expression levels of genes in close chromosomal proximity tend to show greater similarity in gliomas (red) than in corresponding normal brain tissues (green). Moreover, the black curve represents mean values and standard deviations of the average autocorrelation function for randomly permuted glioma gene expression profiles from [33] across 100 repeats. The observation of significant local chromosomal dependencies in tumor expression profiles compared to permuted expression profiles motivates the development of autoregressive higher-order HMMs for the analysis of tumor expression profiles.

