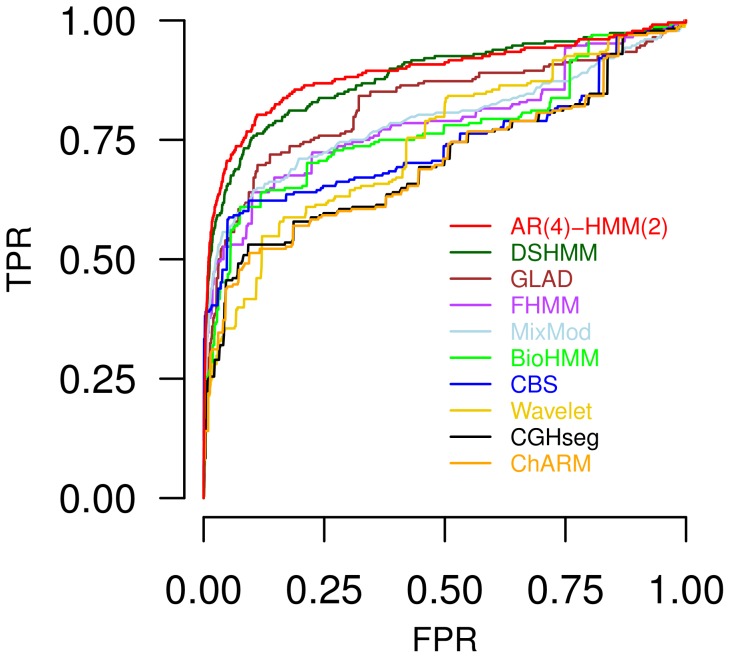
Figure 4. Comparison of an autoregressive higher-order HMM to related existing methods.
Comparison of the AR( )-HMM(
 ) and related methods with respect to the identification of overexpressed genes with at least three-fold increased copy numbers based on breast cancer data from [3]. The performance of each method is quantified by a receiver operating characteristic (ROC) curve displaying the true positive rate (TPR) reached at different levels of false positive rates (FPR). The AR(
 )-HMM(
 ) with a fourth-order autoregressive emission process and a second-order state-transition process reaches the best performance (red).

