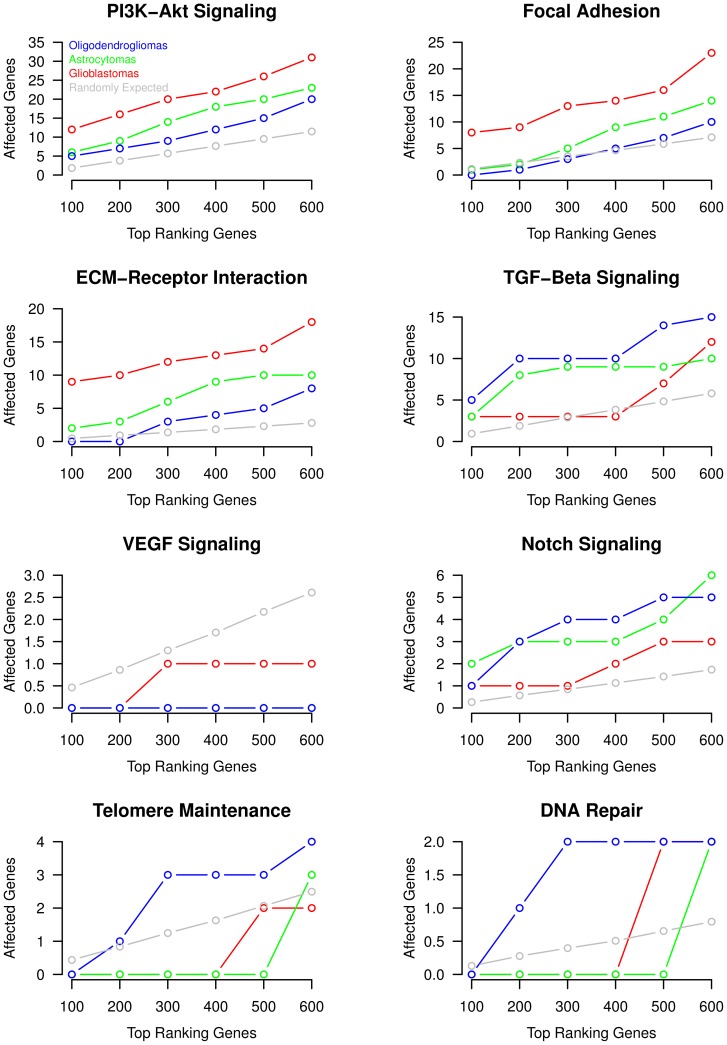
Figure 5. Most discriminative signaling pathways distinguishing different types of gliomas.
Overview of known cancer signaling pathways identified to show largely distinct patterns of overexpressed genes in oligodendrogliomas, astrocytomas and glioblastomas based on predictions of the AR( )-HMM(
 ). The overlap of the top-ranking overexpressed genes with the specific signaling pathways is quantified from top 100 to top 600. Grey curves show random expectations with respect to the number of genes in a specific pathway. Robust systematic differences between the different types of gliomas are clearly visible.

