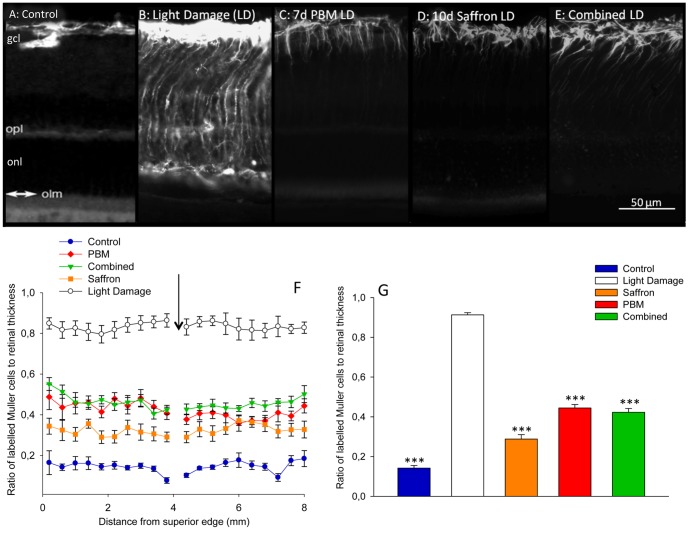
Figure 3. Impact of single and combined neuroprotectants on GFAP labelling of Müller cells.
A–E: Representative GFAP labelling in control (A), light damage (B), 7 d PBM (C), 10 d saffron (D) and combined treatment (E) groups, 1 w after light damage. Light damage induced the up-regulation of GFAP in the radially oriented Müller cells; the protein is visible along the full length of the Müller cells, from the ILM to the OLM. F: Length of the Müller processes expressing GFAP as a function of distance from superior edge in the five experimental groups. The arrow shows the position of the optic disc. Each point shows the mean labelled length; error bars show standard deviations of the mean. G: Mean length of Müller processes expressing GFAP, averaged across superior retina, in: Control (A), Light Damage (B), 7 days PBM (C), 10 days saffron (D) and combined (E) groups. In all treated groups, the length of Müller cells expressing GFAP was less than in the light damage group. The error bars show standard errors of the mean. Statistical significance indicator: (***) p<0.001.

