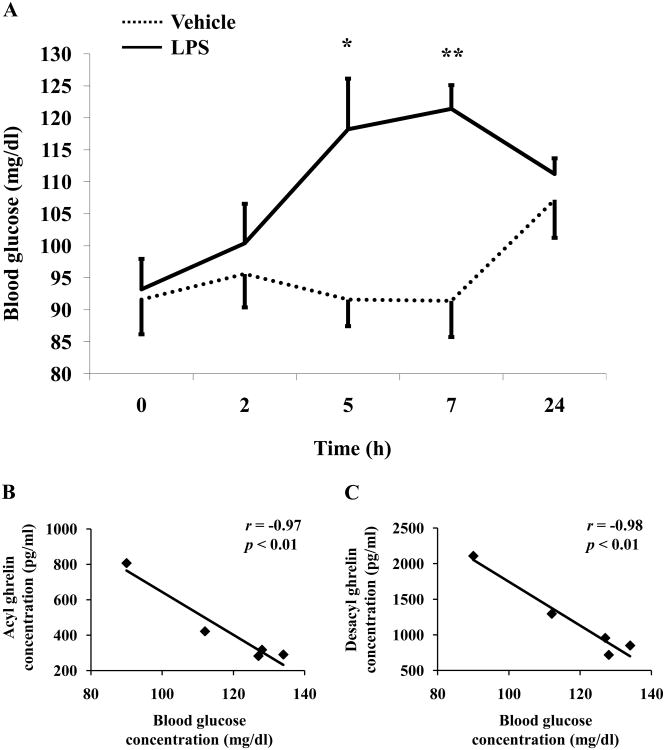
Fig. 4.
LPS increases blood glucose levels in rats. Overnight fasted rats were injected ip with LPS (100μg/kg body weight) or vehicle (saline) and blood was withdrawn at the time points indicated at the x-axis for measurement of acyl and total ghrelin levels. At the same time, blood glucose levels were assessed (A). Each line represents the mean ± sem of 5 rats/group. * p < 0.05 and ** p < 0.01 vs. vehicle. Correlations between plasma acyl (B) or desacyl ghrelin (C) and blood glucose from 5h post LPS injection. Values for r and p are indicated in each graph.

